Gene: TSC2
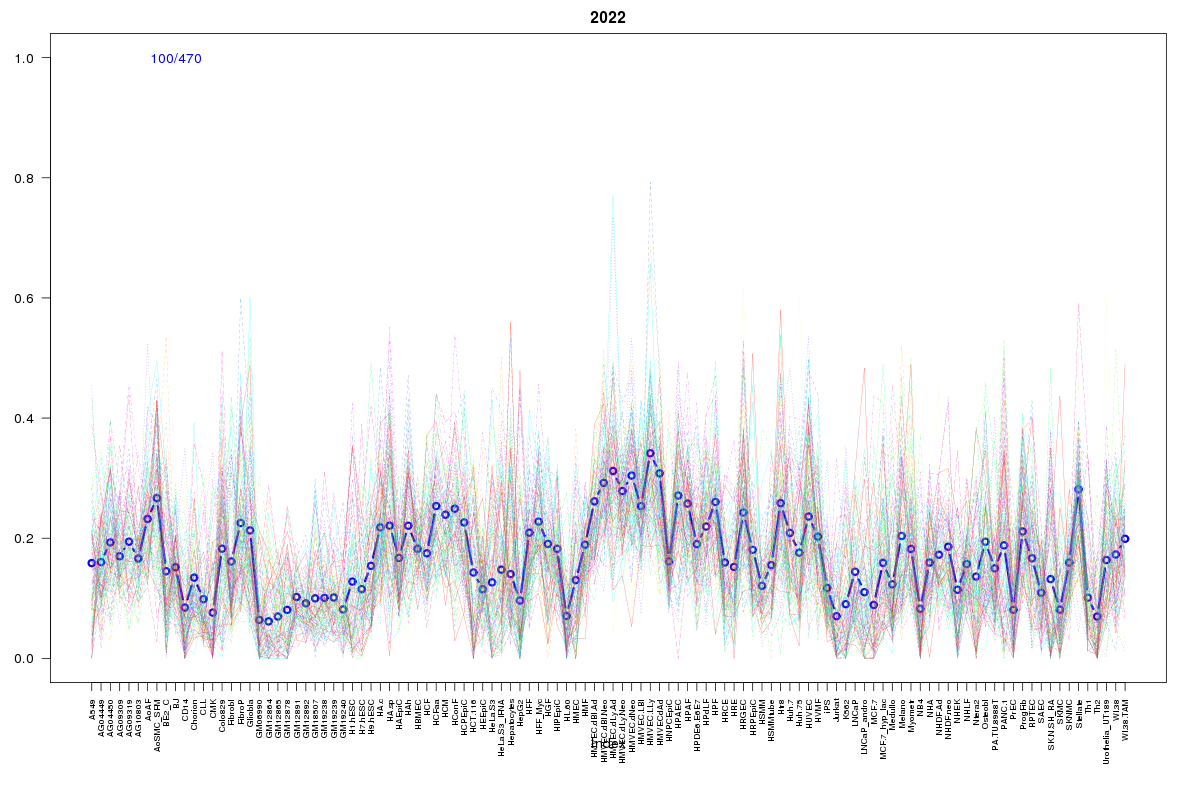
chr16: 2097465-2138713Expression Profile
(log scale)
Graphical Connections
Distribution of linked clusters:
You may find it interesting if many of the connected DHS sites belong to the same cluster.| Cluster Profile | Cluster ID | Number of DHS sites in this cluster |
|---|---|---|
 | 570 | 4 |
 | 1604 | 3 |
 | 1225 | 3 |
 | 2122 | 2 |
 | 1213 | 2 |
 | 2279 | 1 |
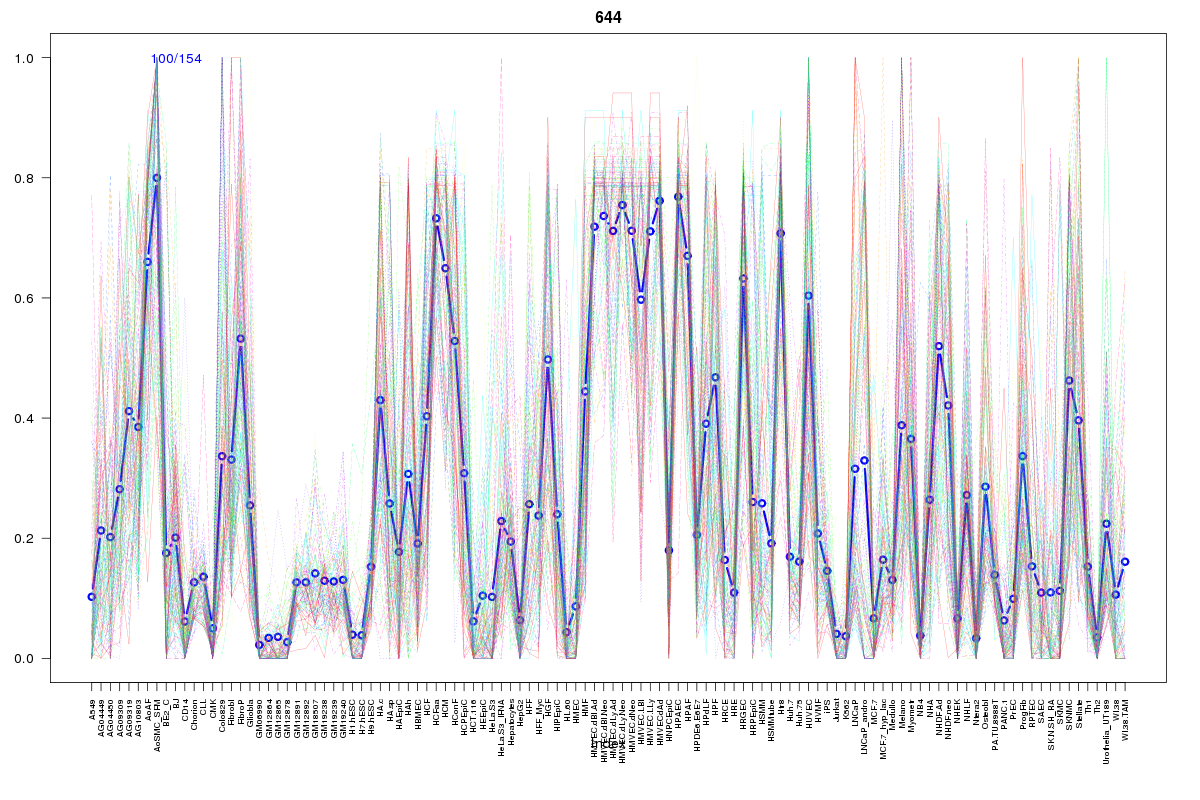 | 644 | 1 |
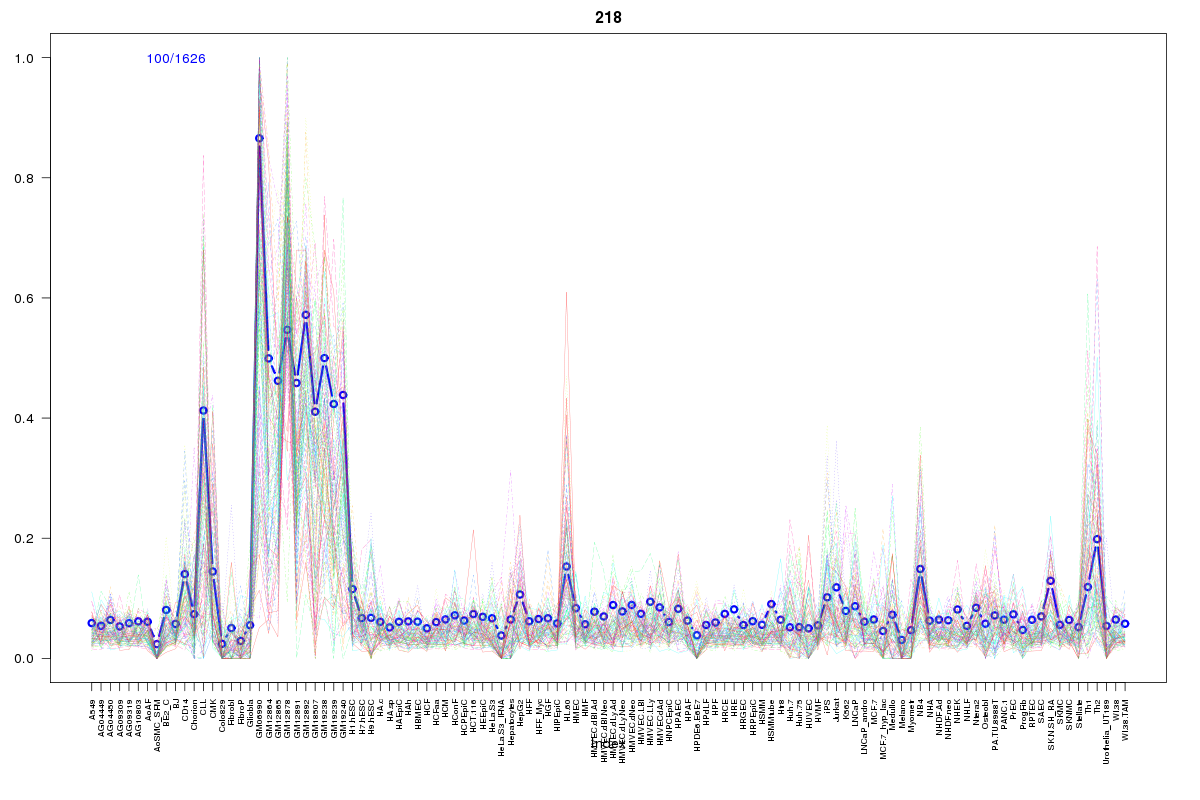 | 218 | 1 |
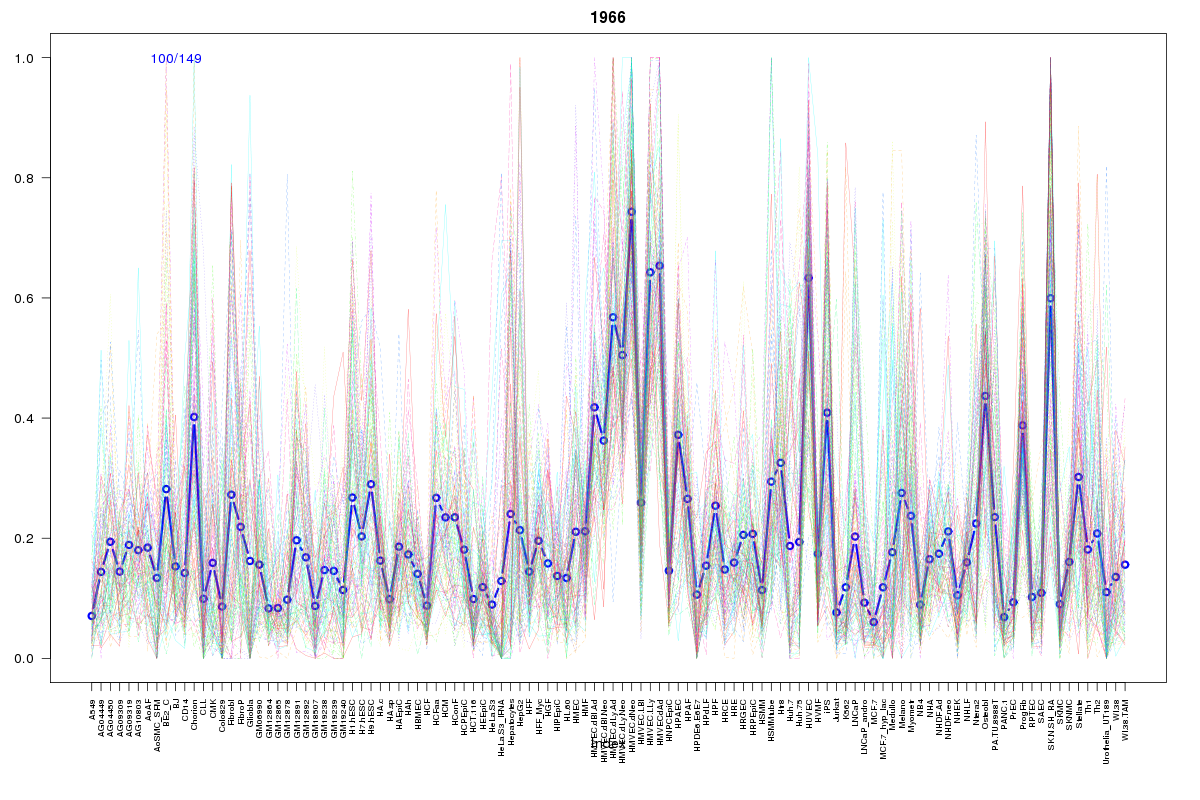 | 1966 | 1 |
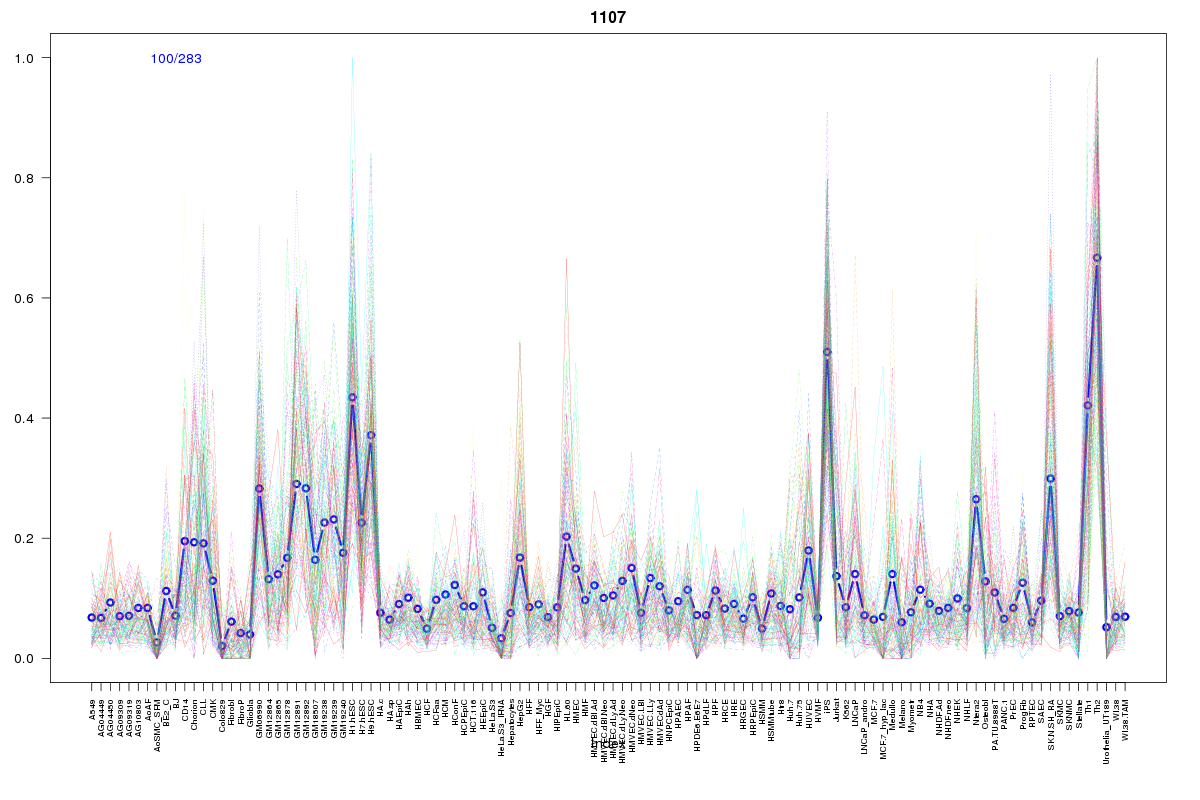 | 1107 | 1 |
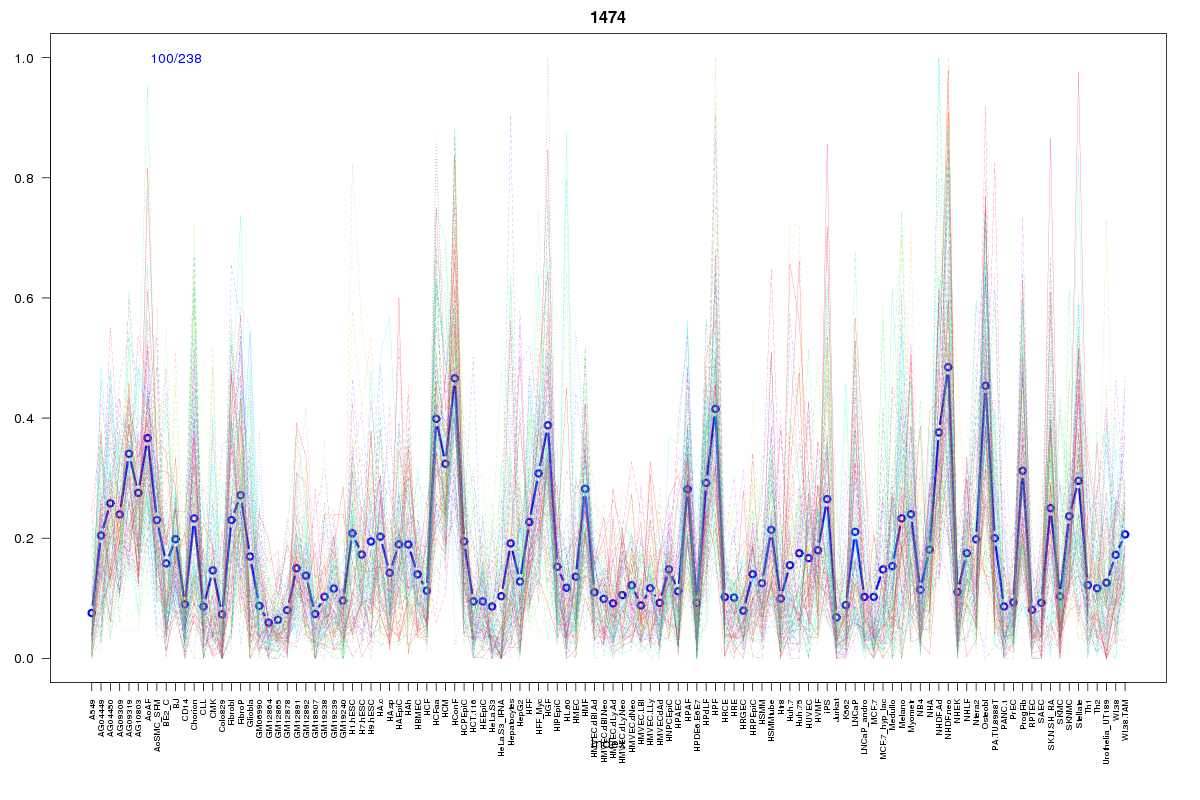 | 1474 | 1 |
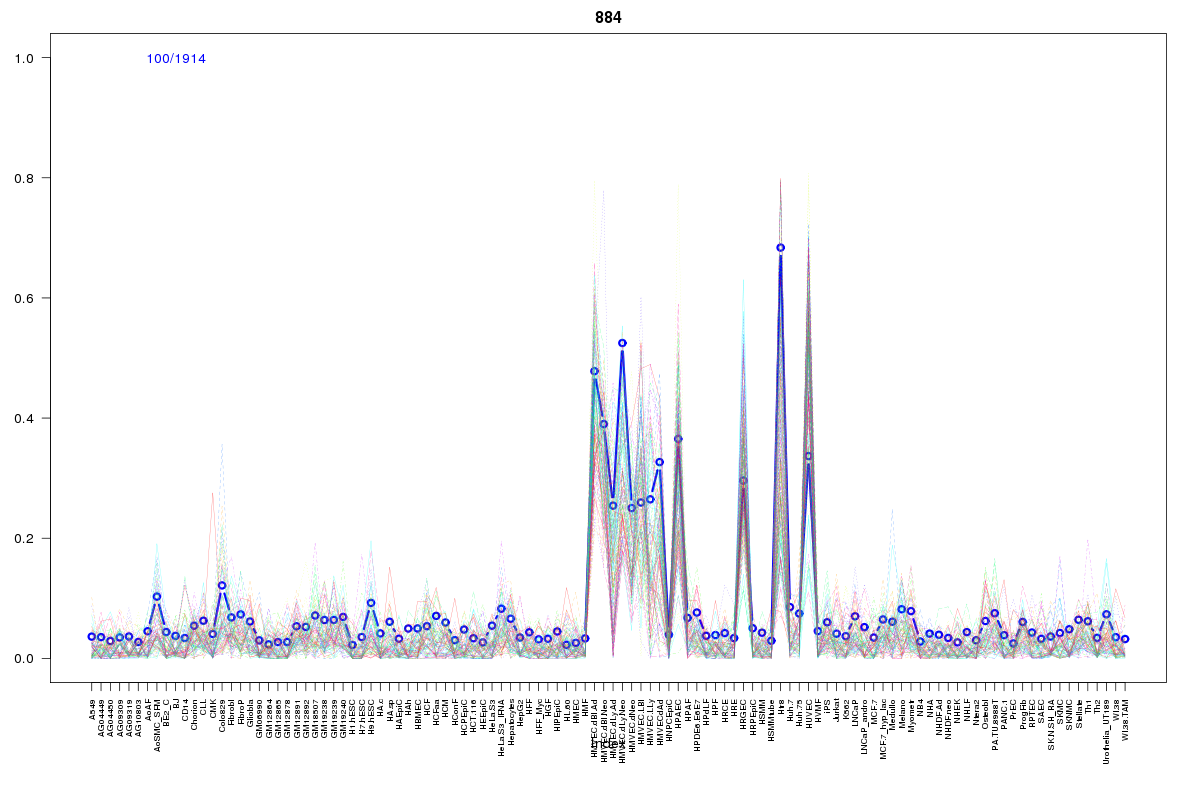 | 884 | 1 |
 | 1008 | 1 |
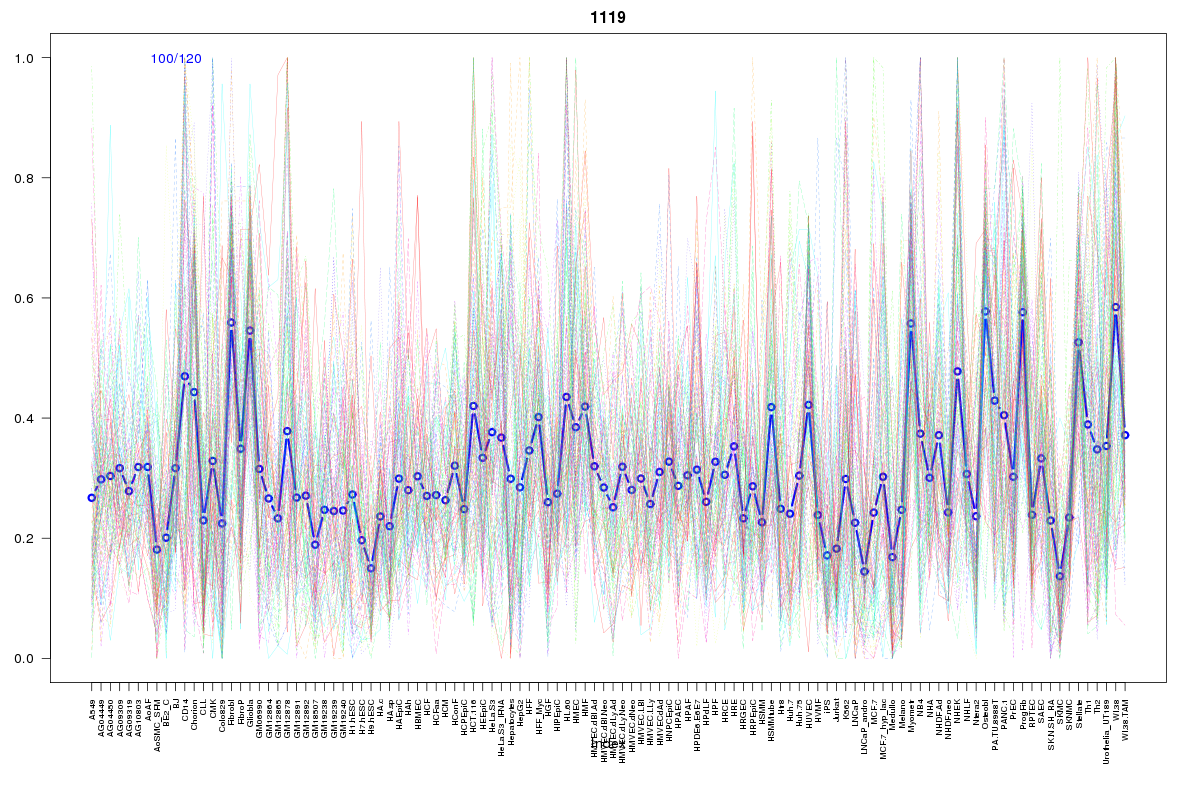 | 1119 | 1 |
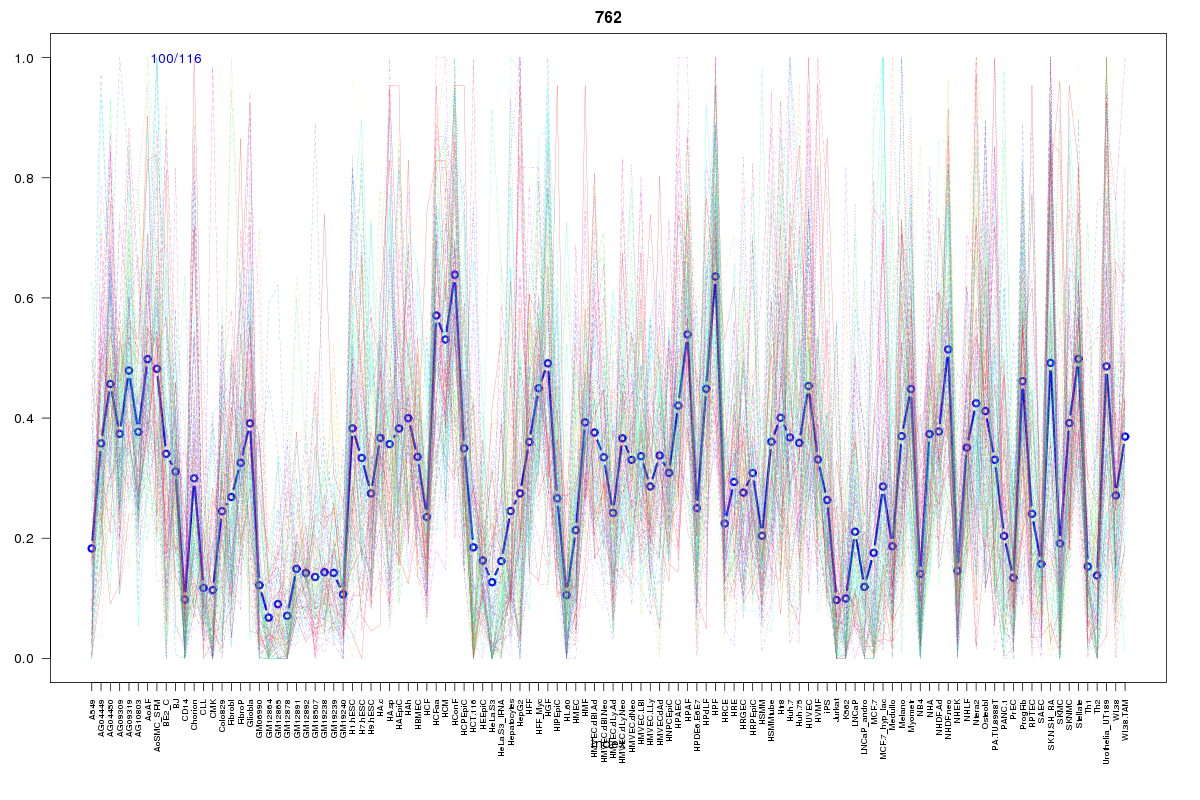 | 762 | 1 |
 | 1157 | 1 |
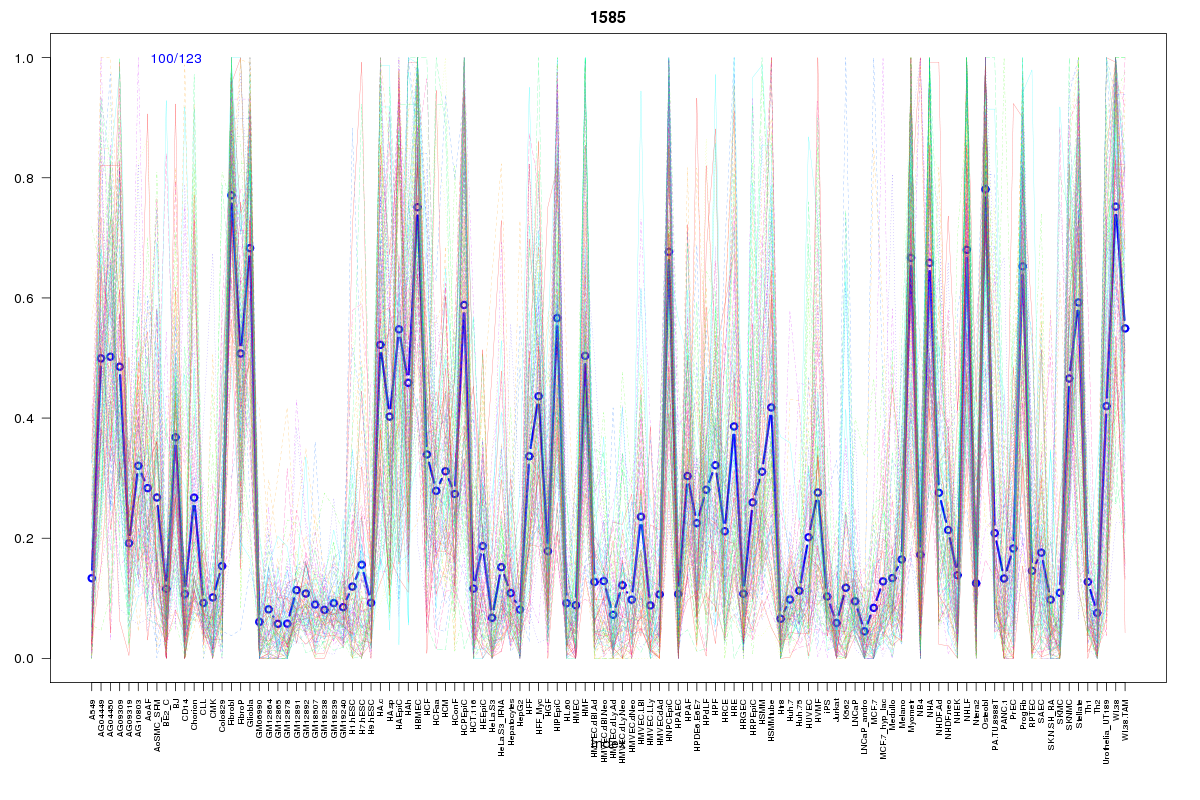 | 1585 | 1 |
 | 1605 | 1 |
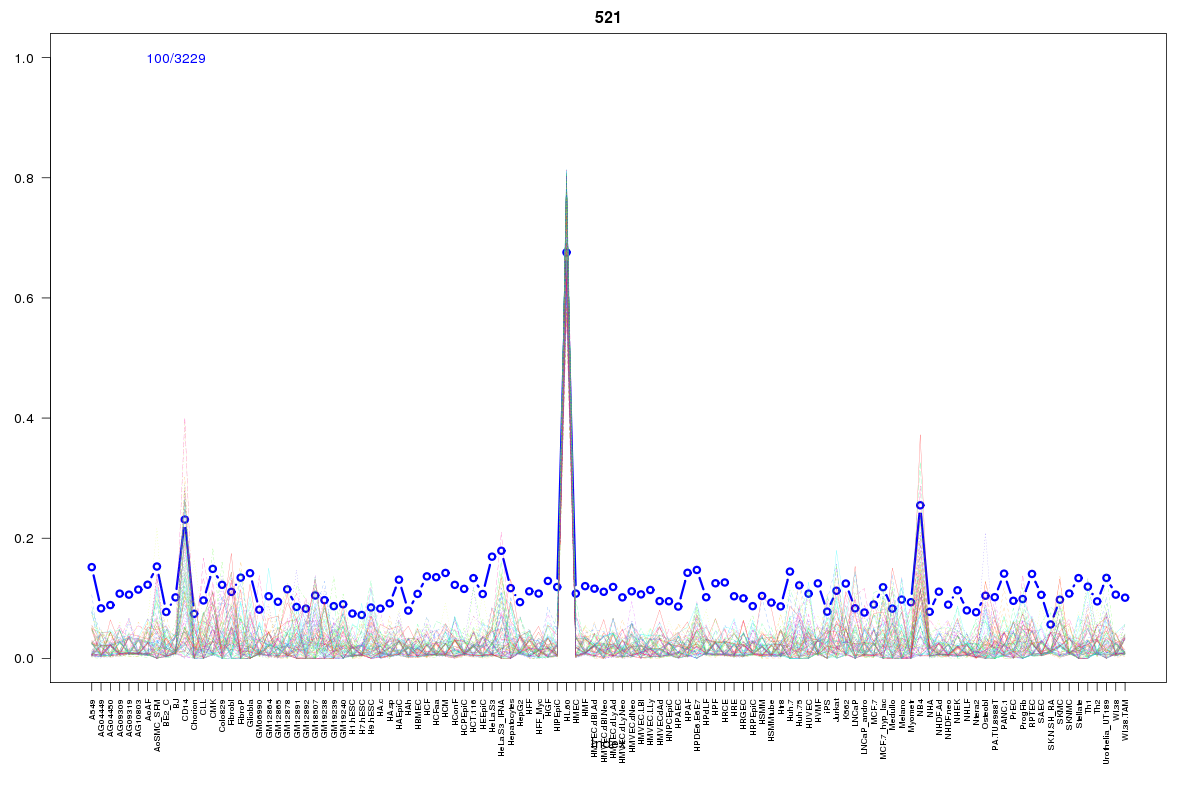 | 521 | 1 |
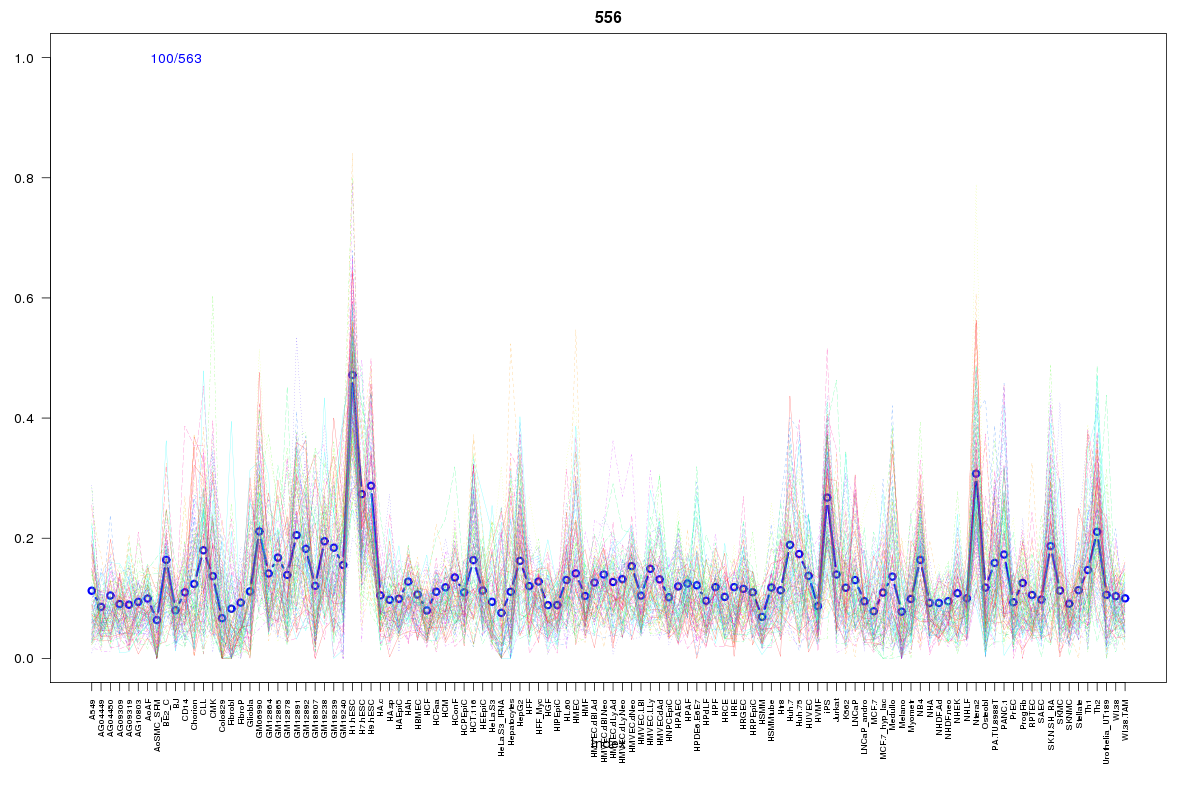 | 556 | 1 |
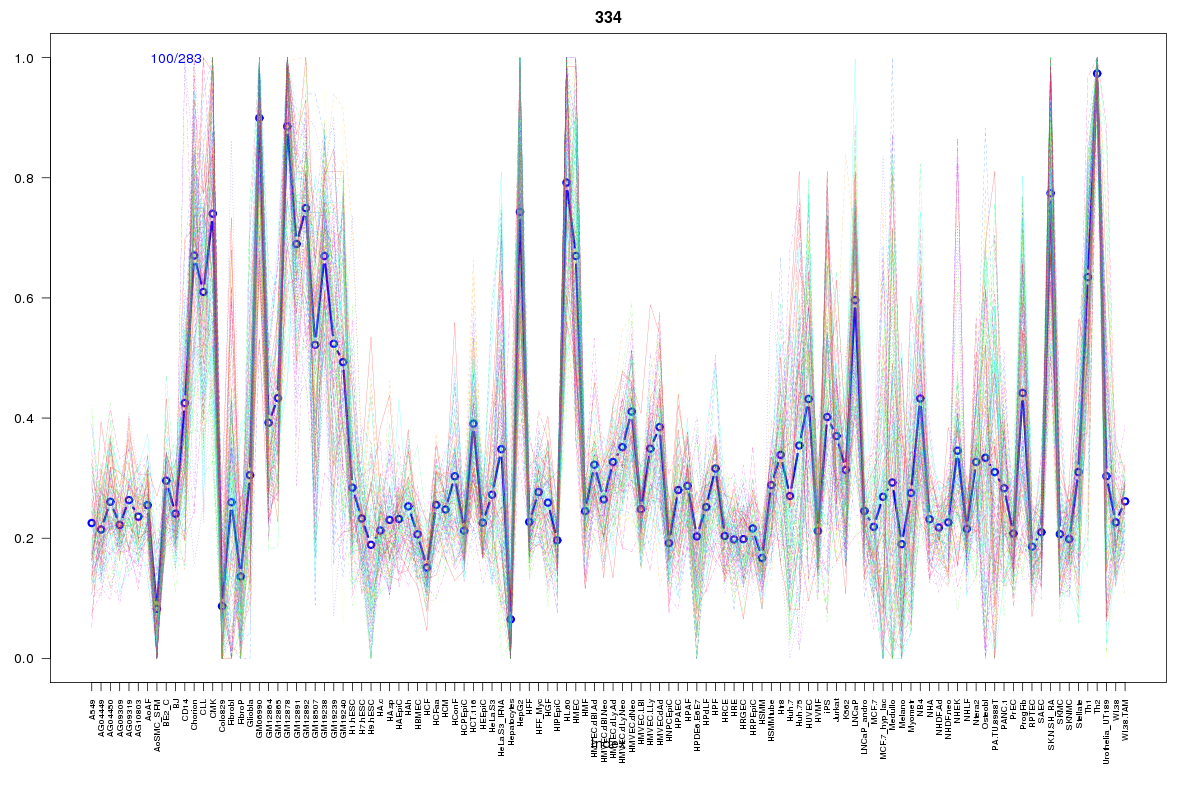 | 334 | 1 |
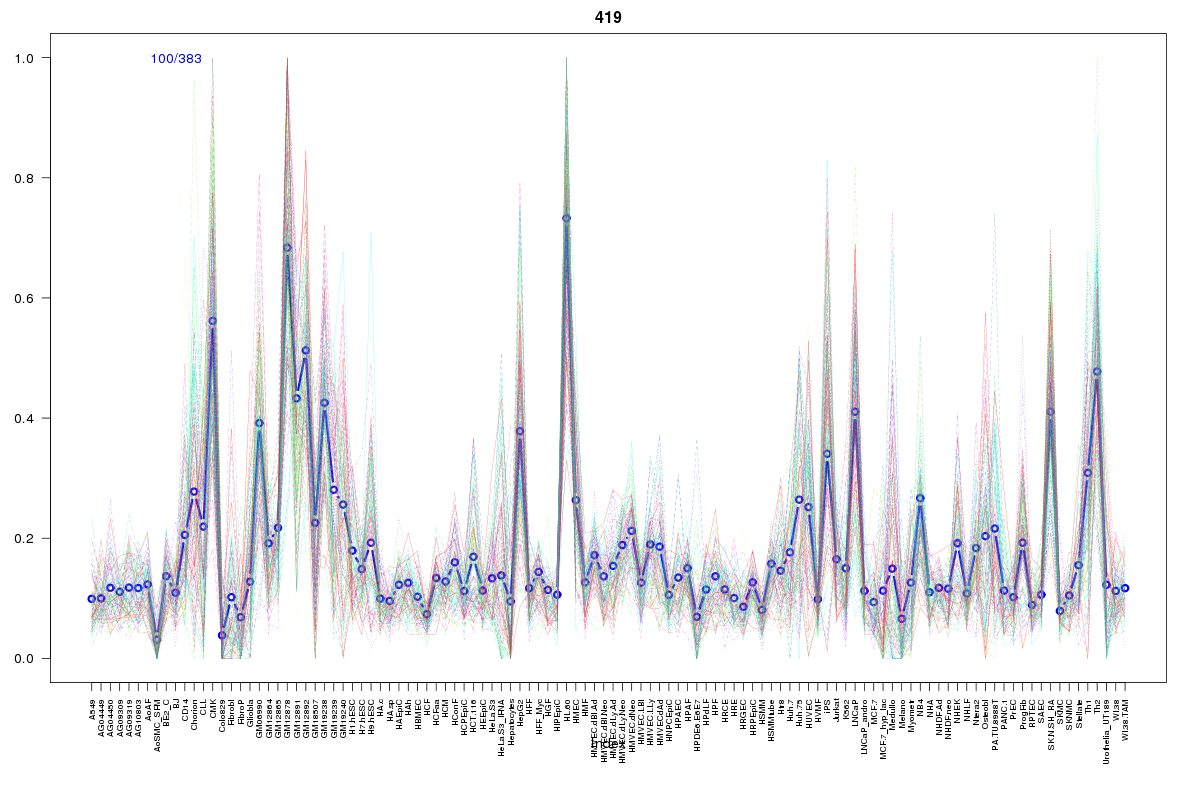 | 419 | 1 |
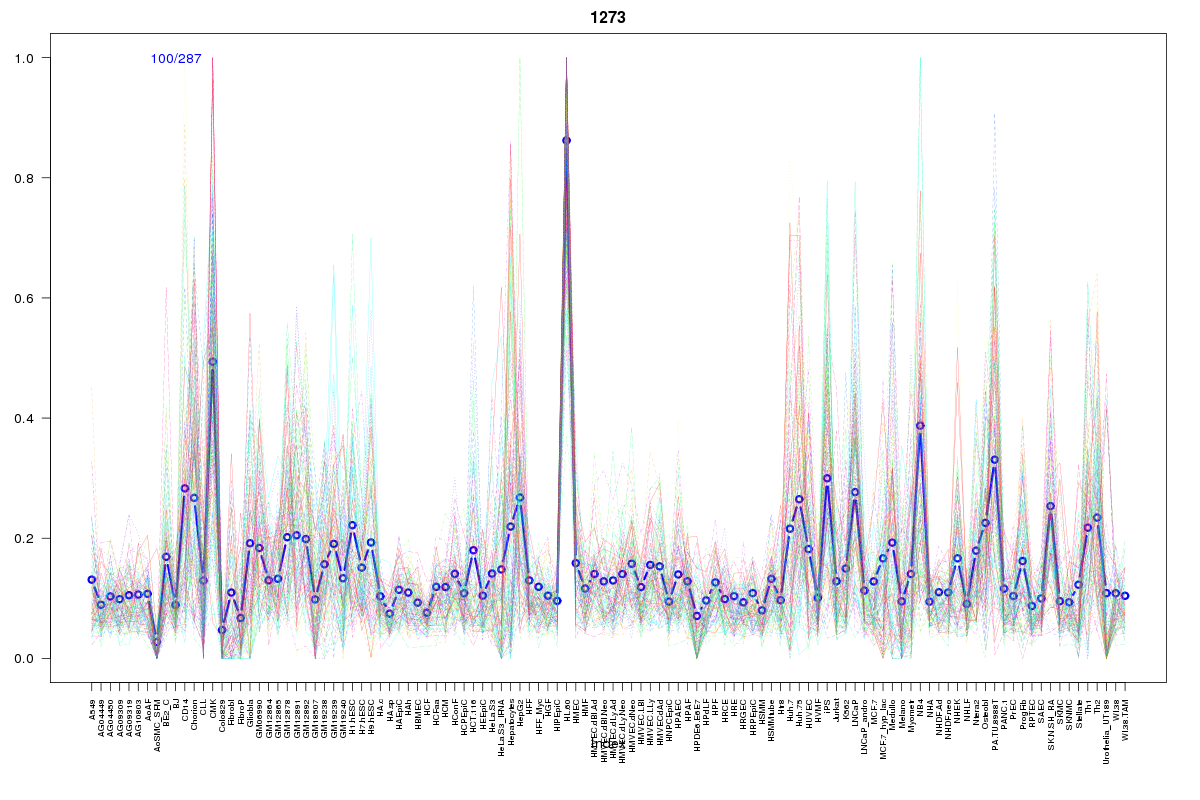 | 1273 | 1 |
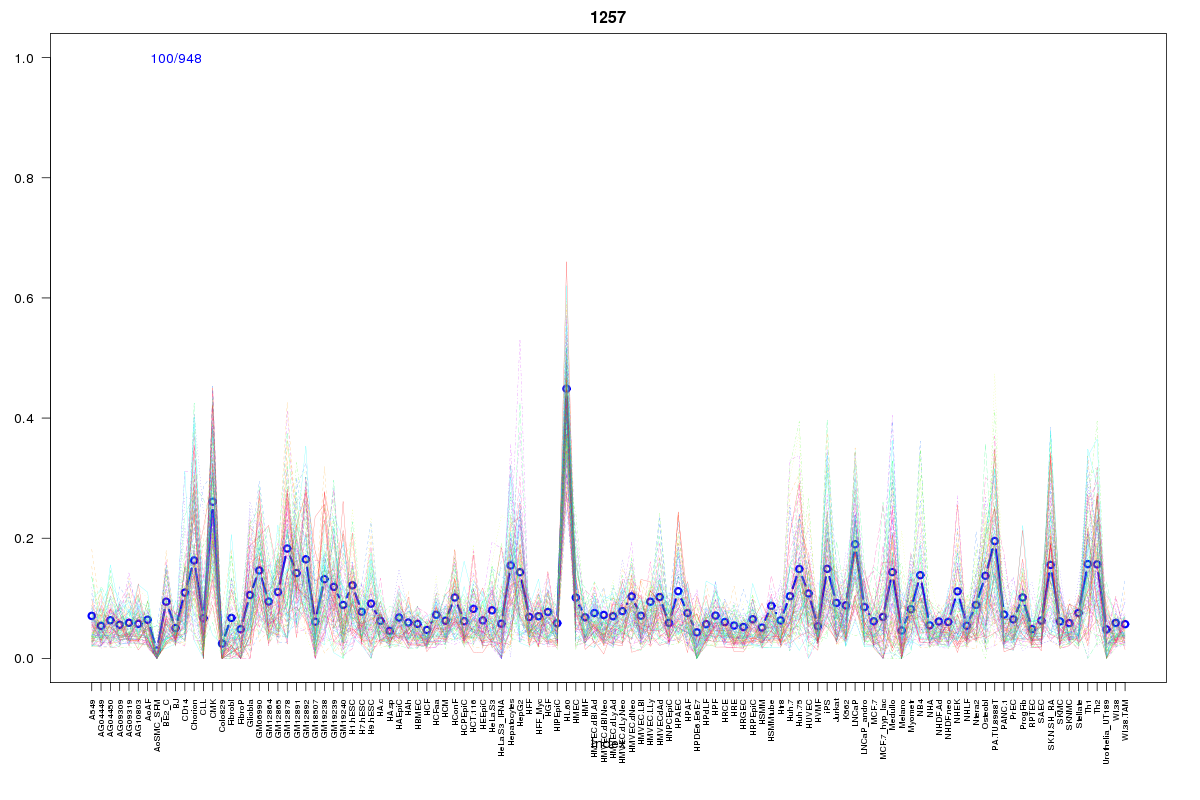 | 1257 | 1 |
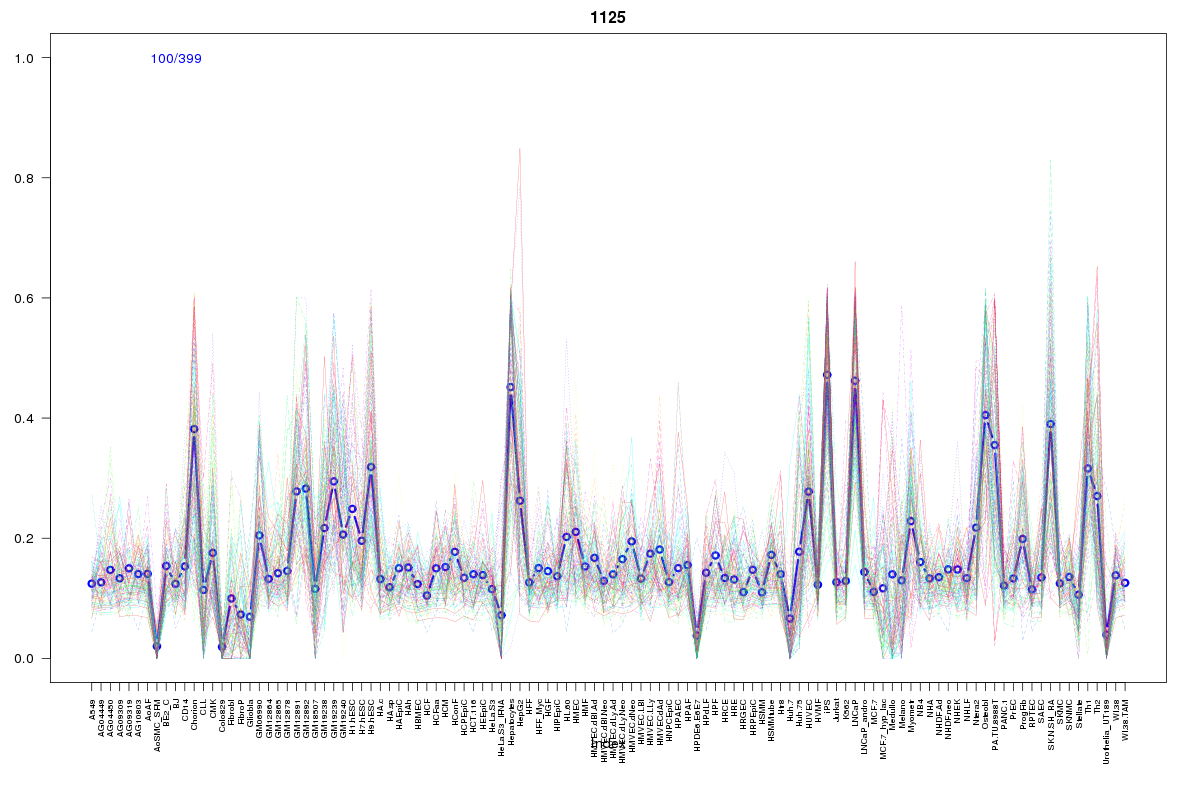 | 1125 | 1 |
 | 2022 | 1 |
Resources
BED file downloads
Connects to 35 DHS sitesTop 10 Correlated DHS Sites
p-values indiciate significant higher or lower correlation| Location | Cluster | P-value |
|---|---|---|
| chr16:2209400-2209550 | 644 | 0.001 |
| chr16:2077745-2077895 | 1119 | 0.004 |
| chr16:2085660-2085810 | 762 | 0.004 |
| chr16:2209200-2209350 | 2022 | 0.005 |
| chr16:2209585-2209735 | 1966 | 0.006 |
| chr16:2174025-2174175 | 1605 | 0.015 |
| chr16:2157140-2157290 | 1585 | 0.018 |
| chr16:2210980-2211130 | 1474 | 0.019 |
| chr16:2219640-2219790 | 884 | 0.023 |
| chr16:2030785-2030935 | 2279 | 0.022 |
| chr16:2193520-2193670 | 1225 | 0.022 |
External Databases
UCSCEnsembl (ENSG00000103197)