Gene: ATPIF1
chr1: 28562619-28564616Expression Profile
(log scale)
Graphical Connections
Distribution of linked clusters:
You may find it interesting if many of the connected DHS sites belong to the same cluster.| Cluster Profile | Cluster ID | Number of DHS sites in this cluster |
|---|---|---|
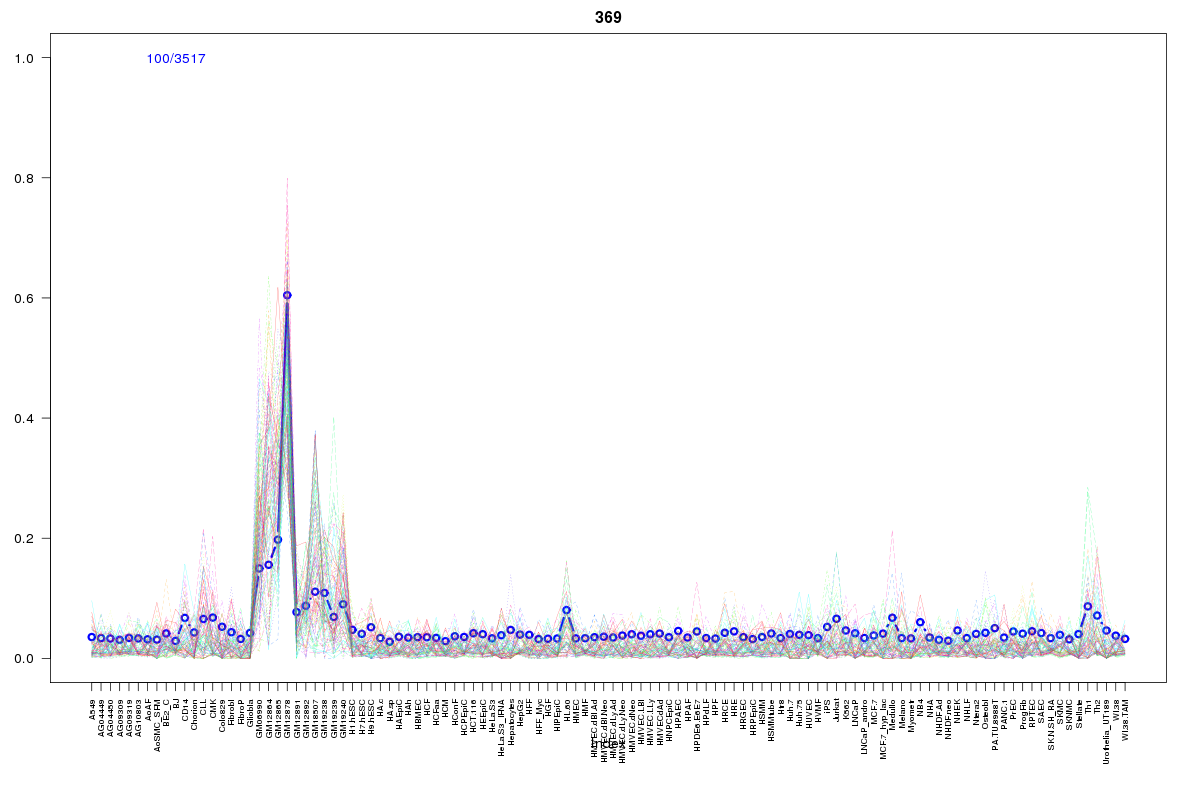 | 369 | 4 |
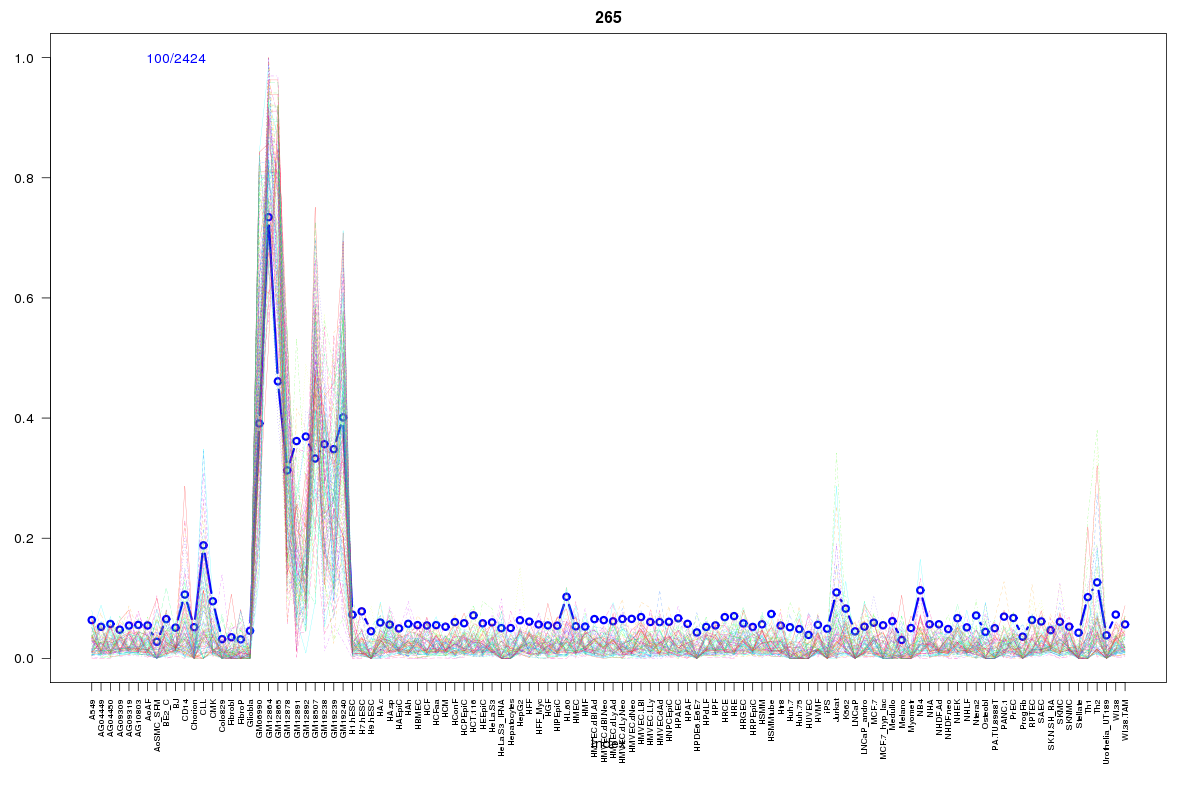 | 265 | 3 |
 | 615 | 3 |
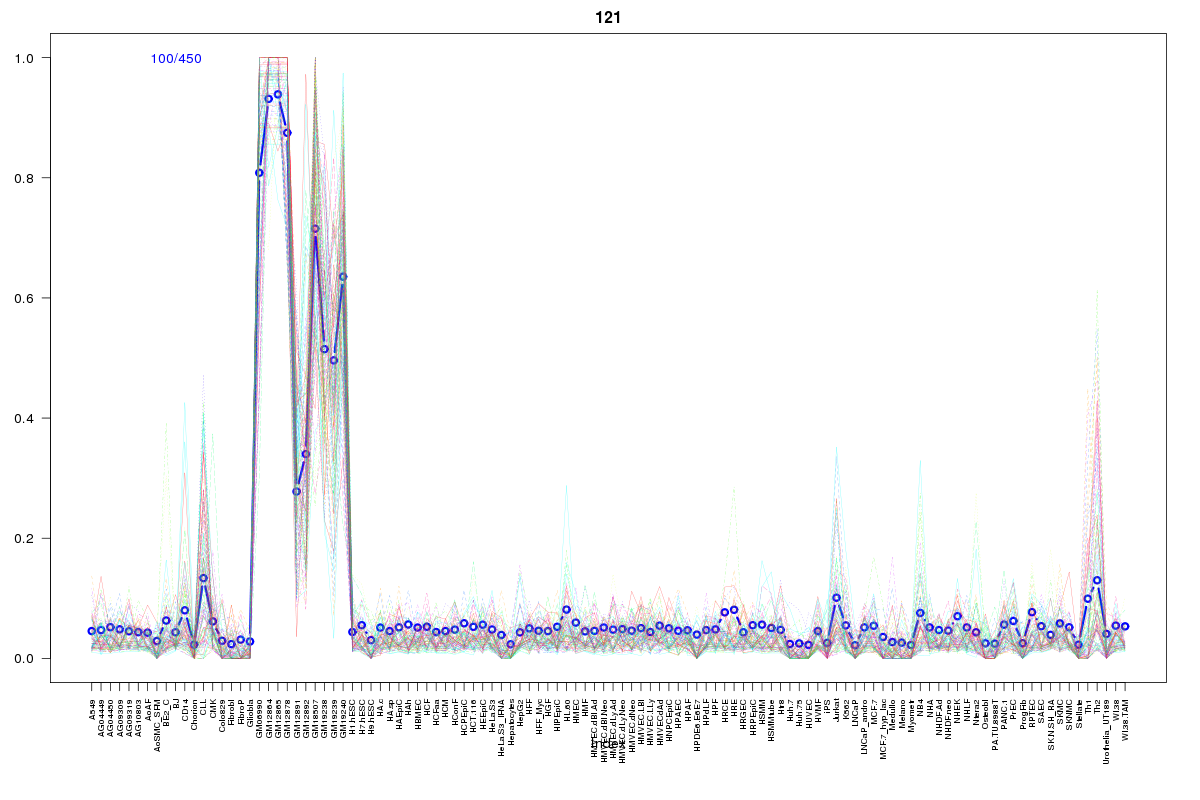 | 121 | 3 |
 | 2211 | 3 |
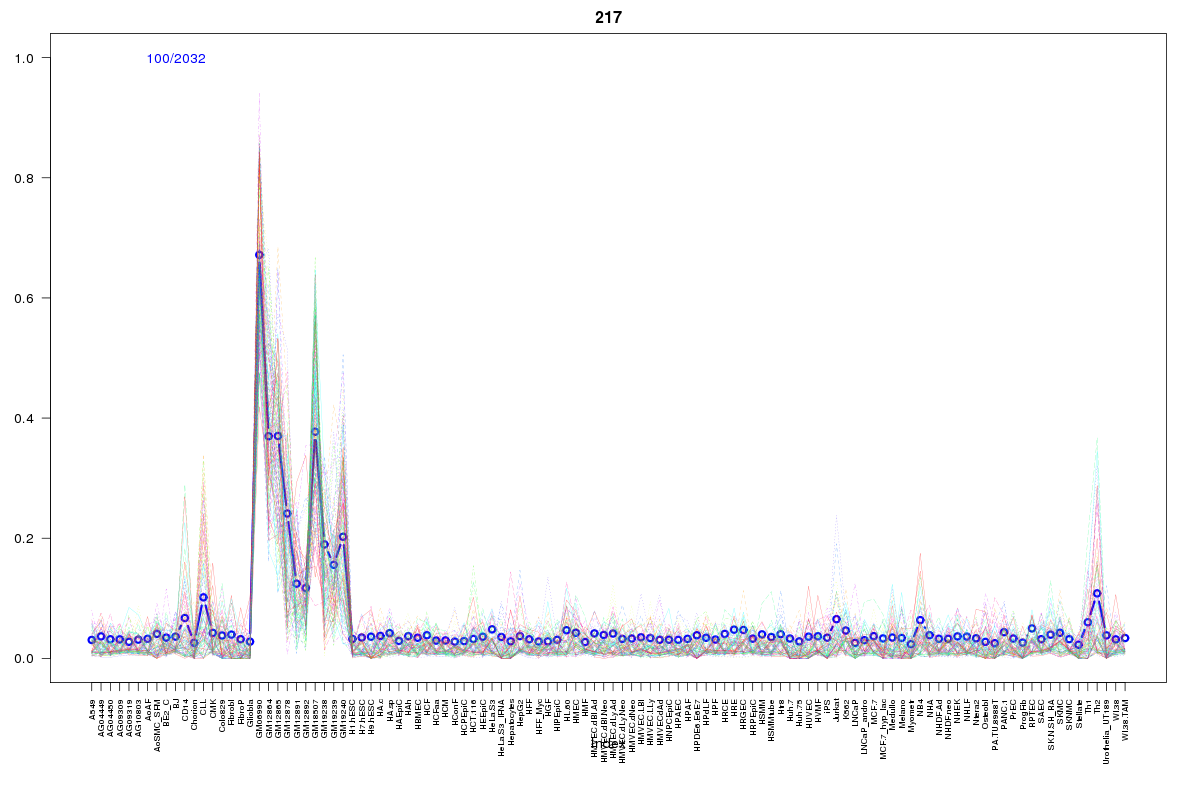 | 217 | 3 |
 | 1056 | 2 |
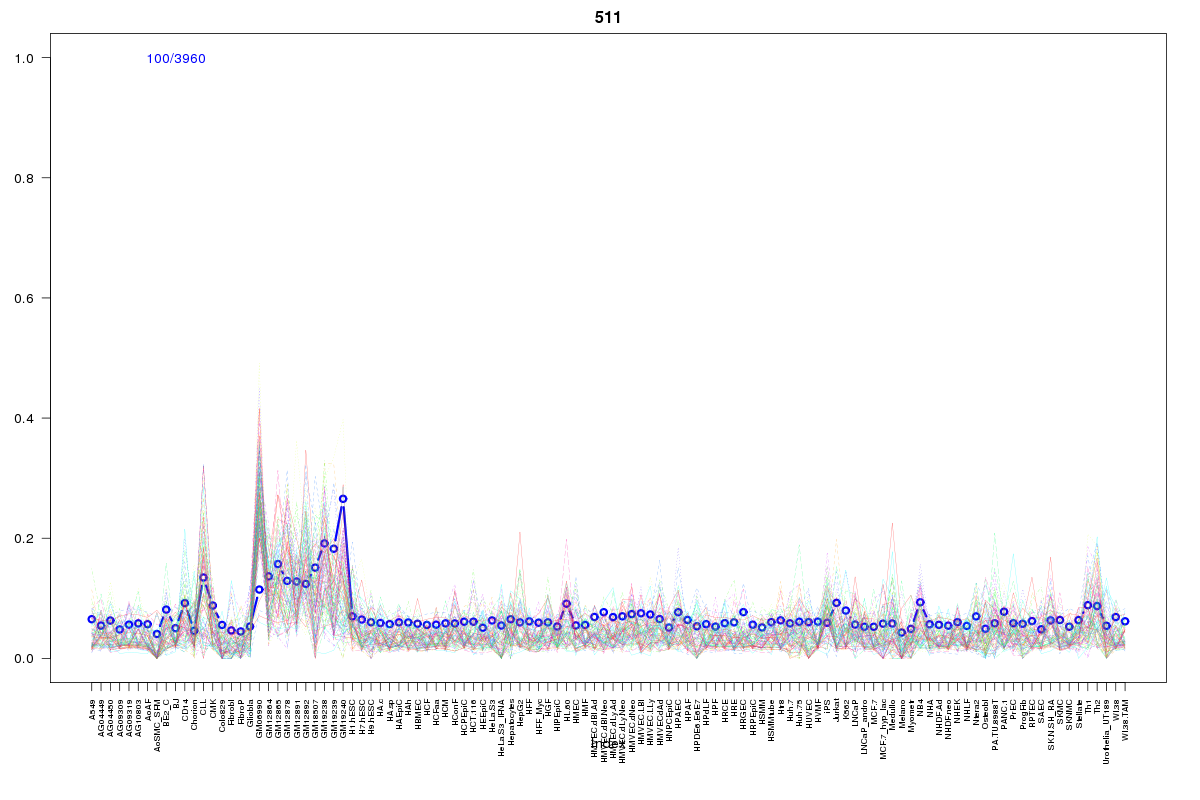 | 511 | 1 |
 | 629 | 1 |
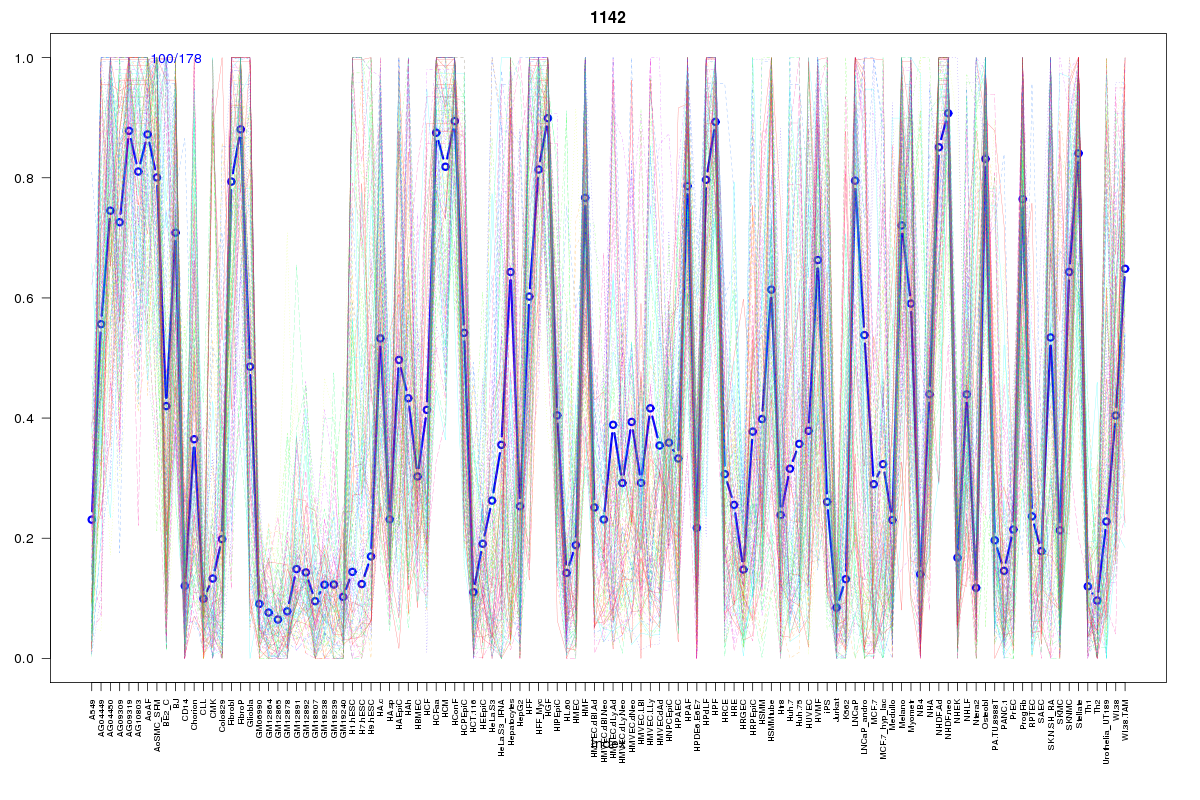 | 1142 | 1 |
 | 1404 | 1 |
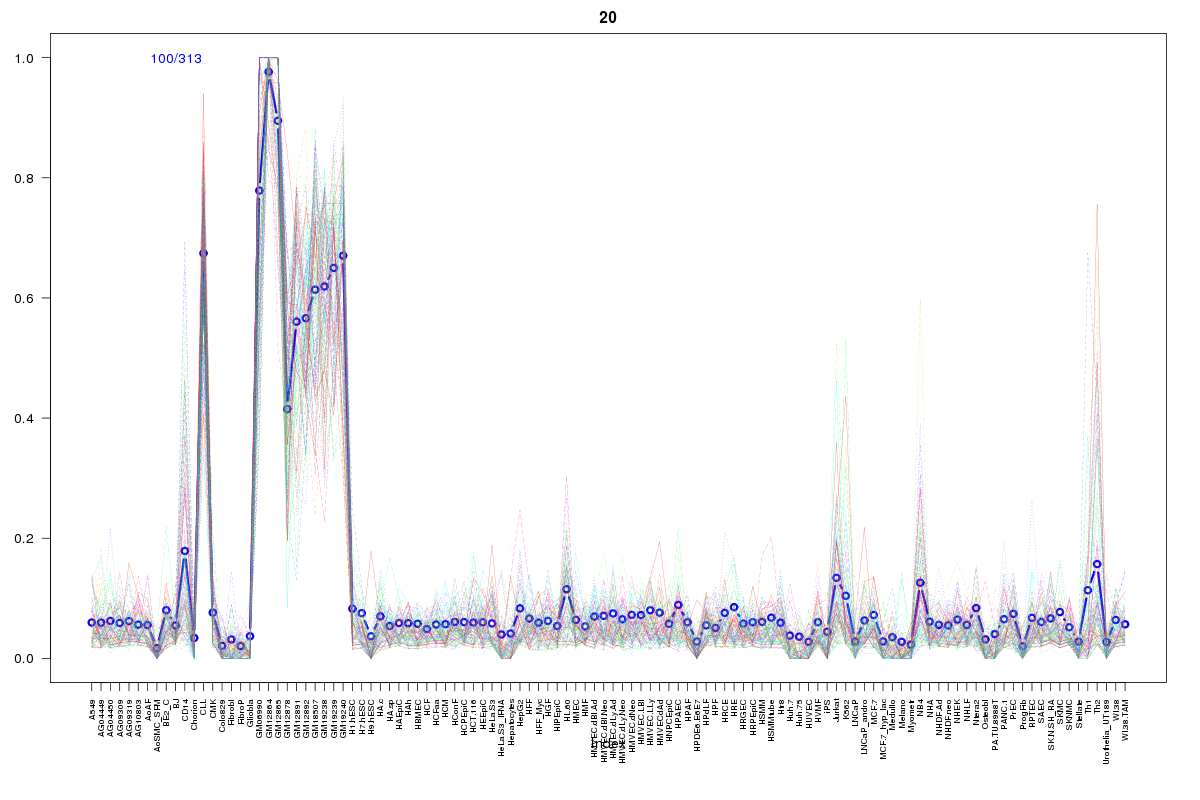 | 20 | 1 |
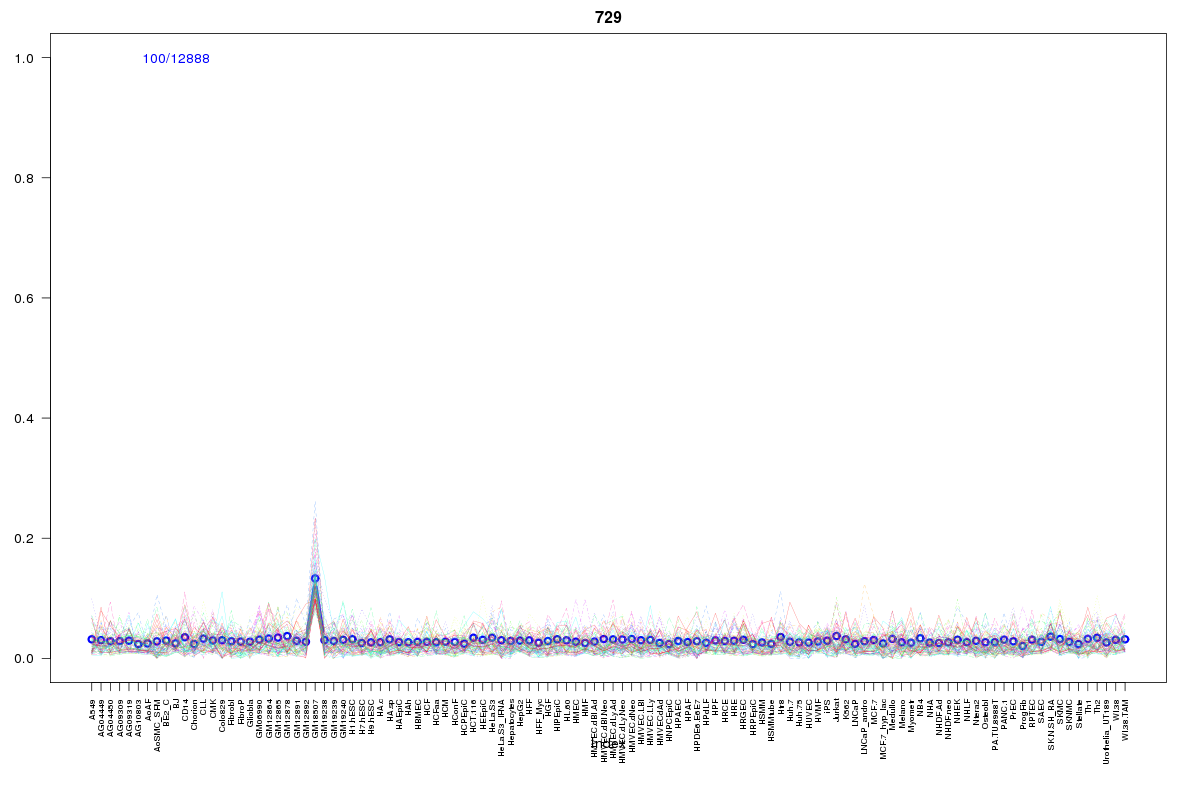 | 729 | 1 |
 | 882 | 1 |
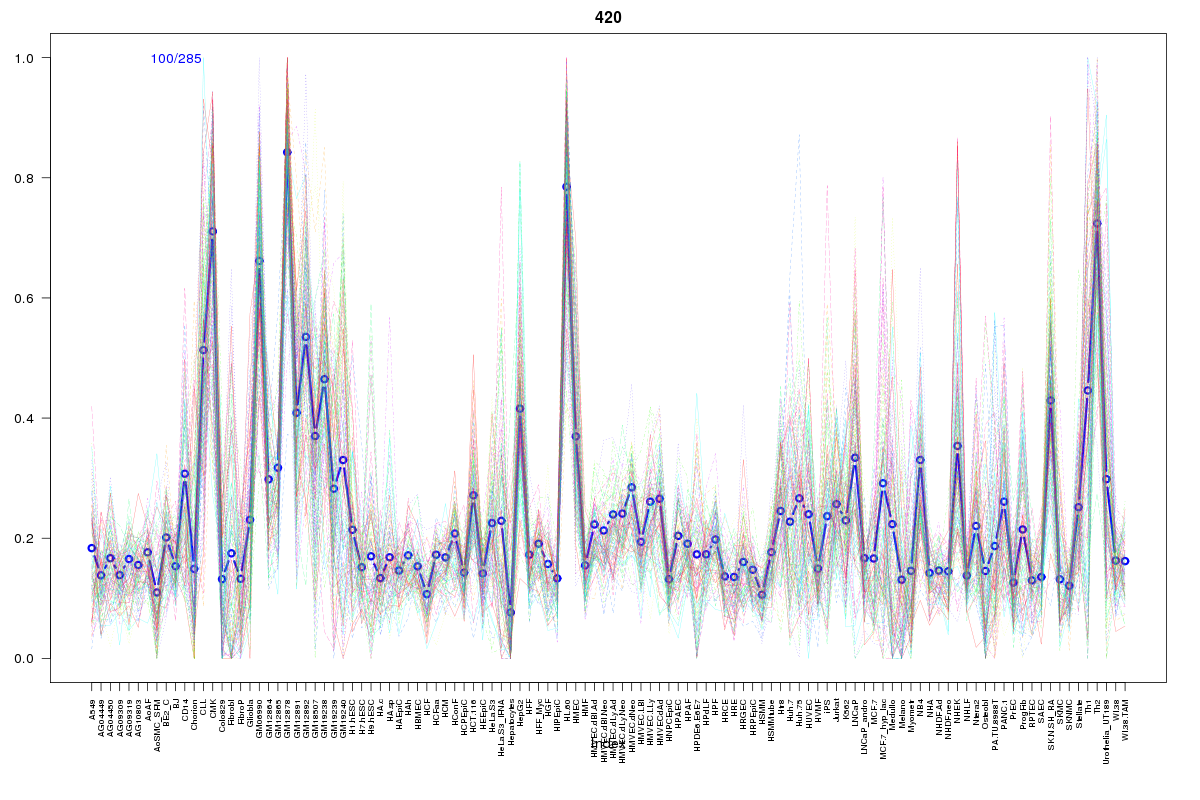 | 420 | 1 |
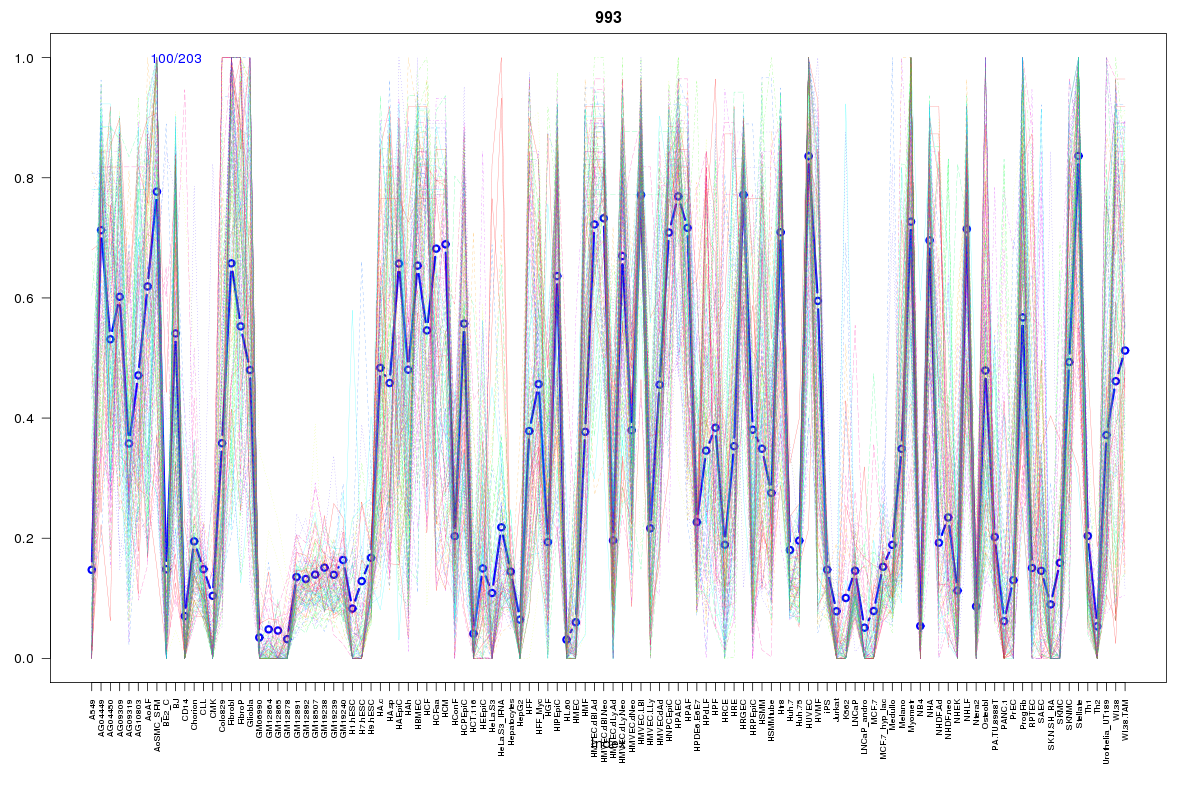 | 993 | 1 |
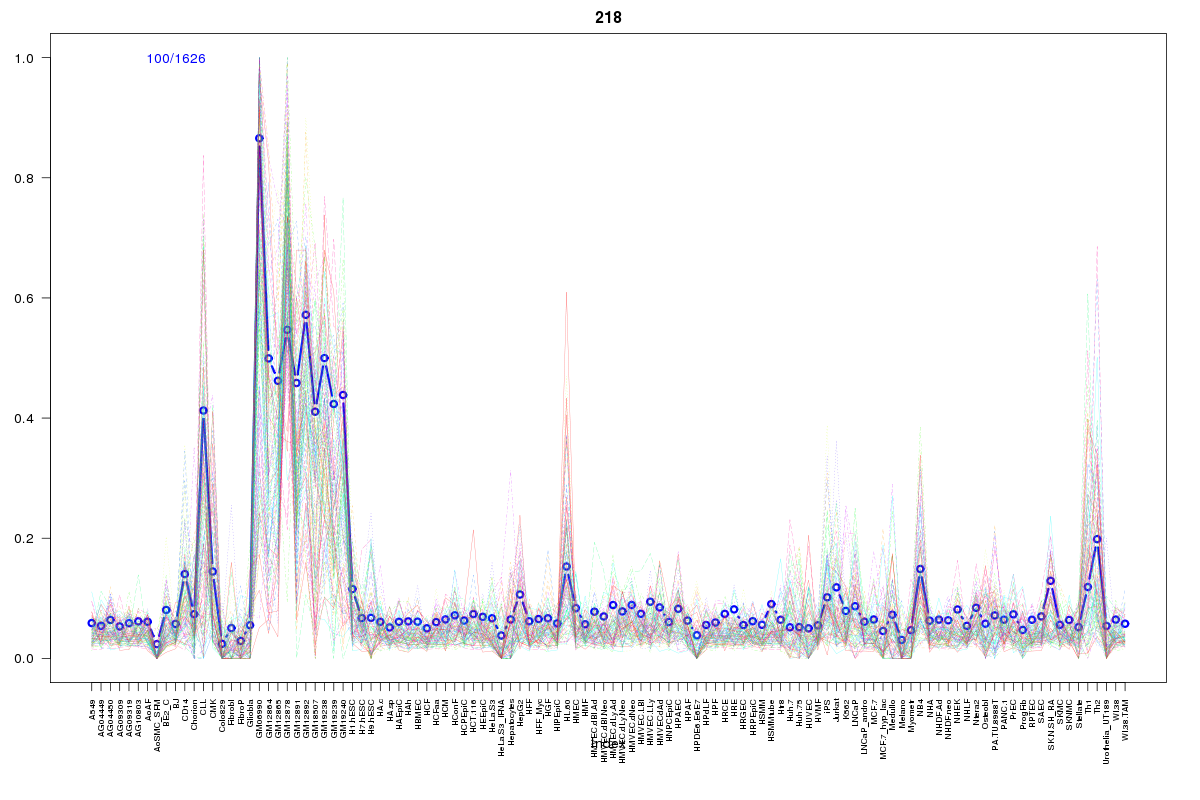 | 218 | 1 |
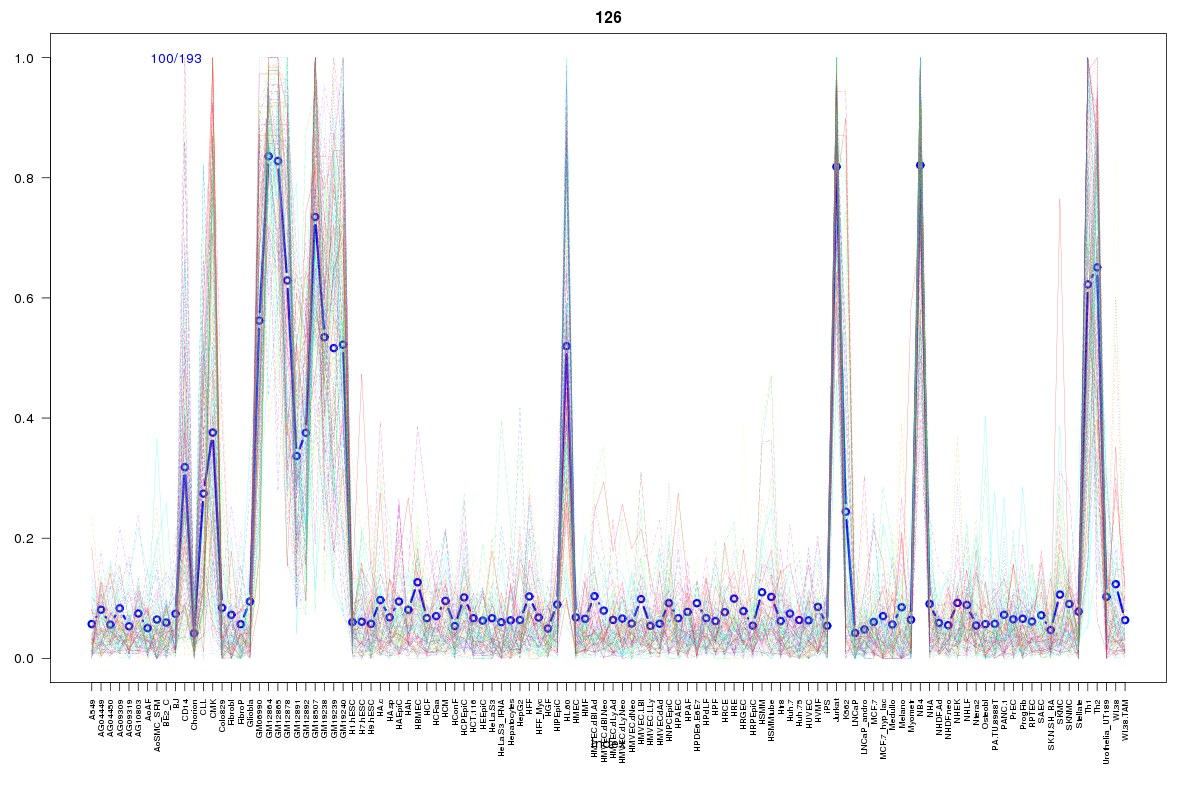 | 126 | 1 |
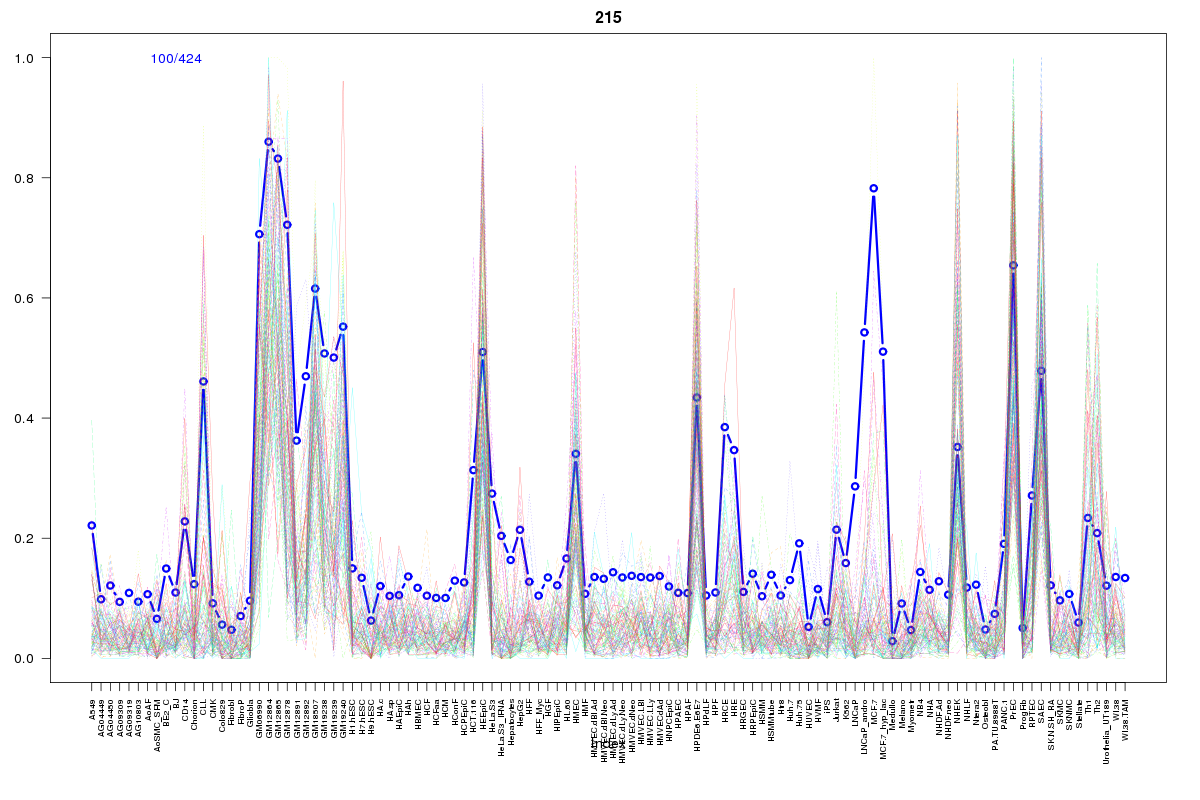 | 215 | 1 |
 | 1605 | 1 |
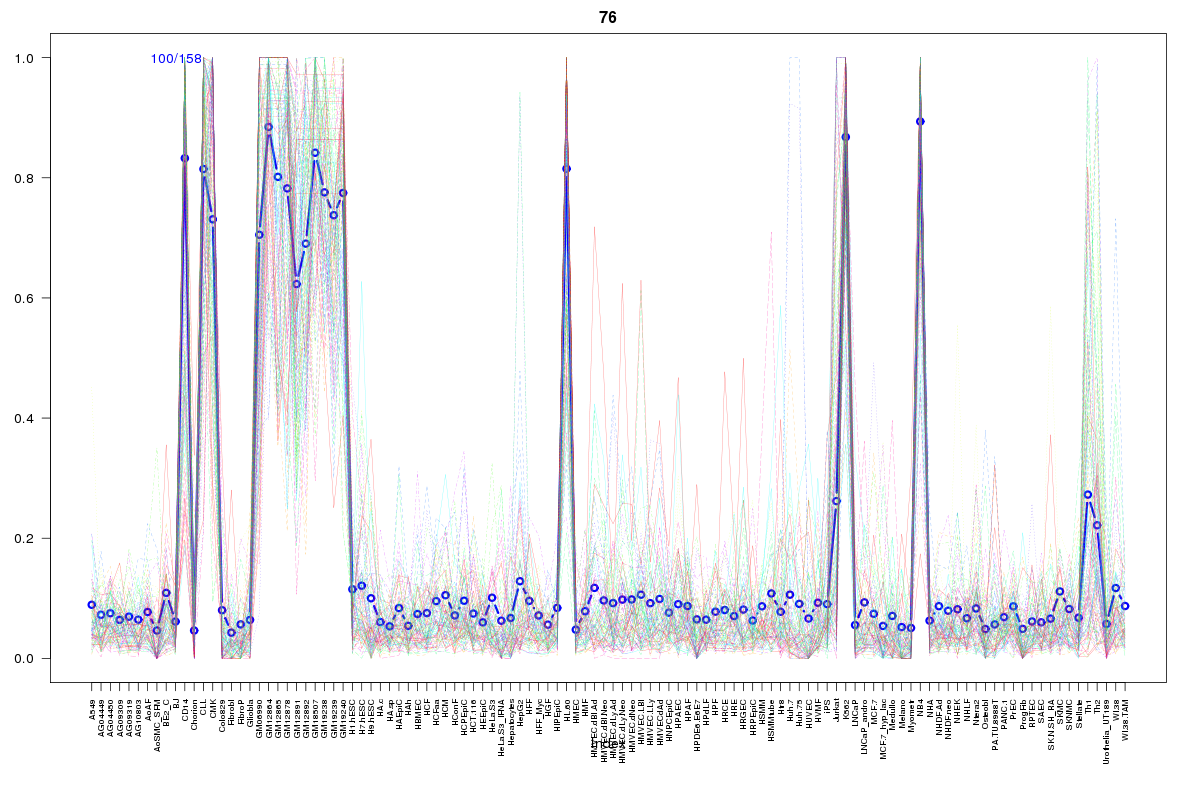 | 76 | 1 |
 | 18 | 1 |
 | 2072 | 1 |
 | 1949 | 1 |
 | 66 | 1 |
 | 2059 | 1 |
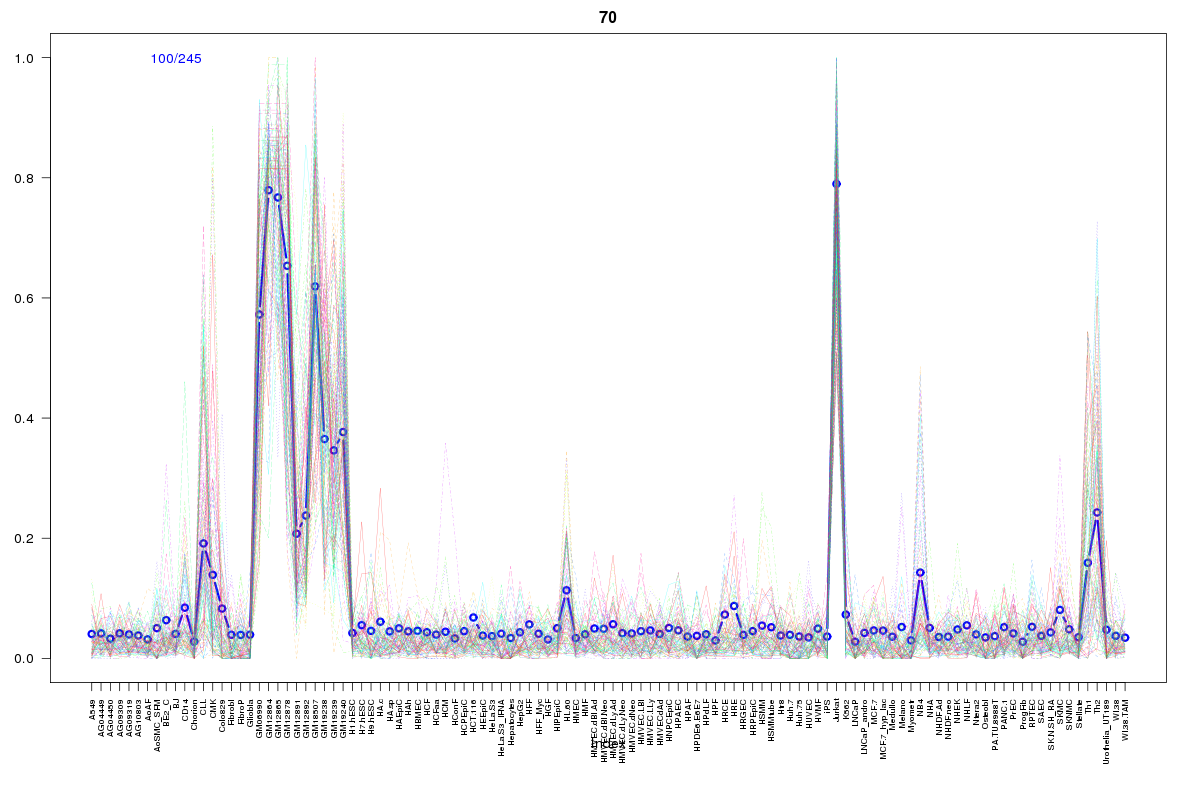 | 70 | 1 |
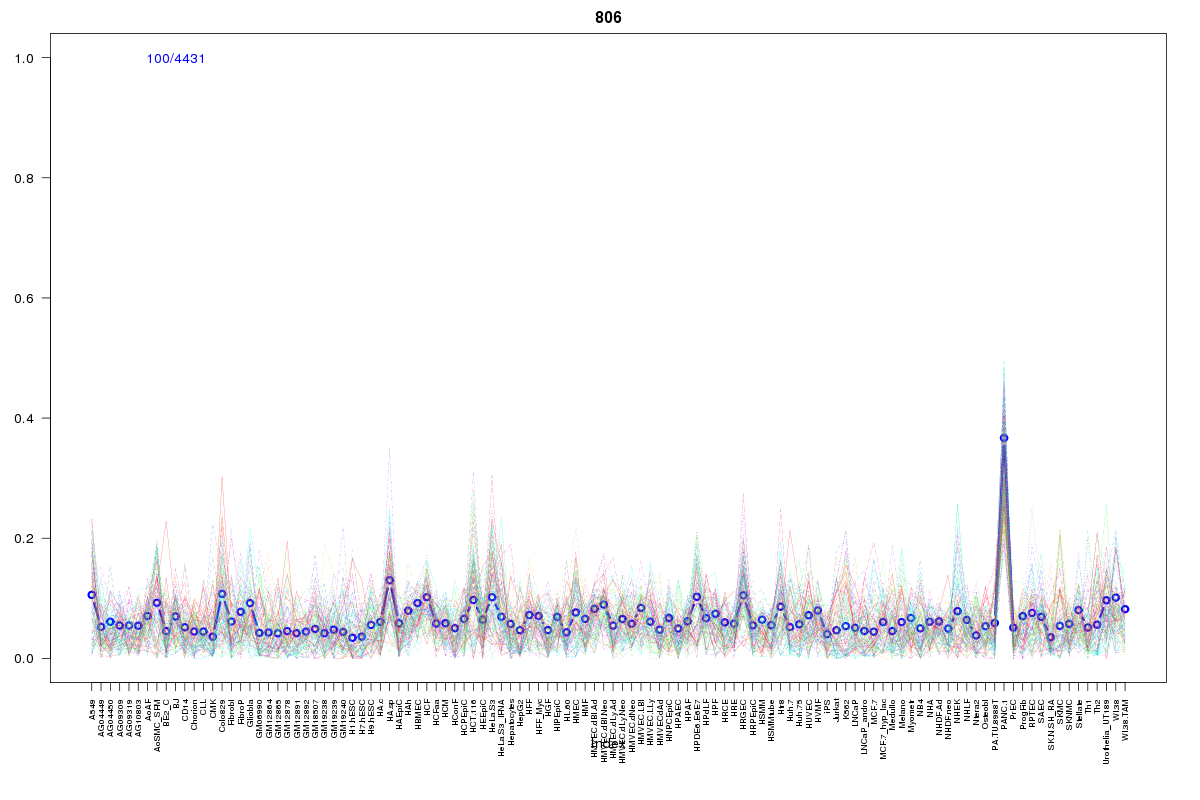 | 806 | 1 |
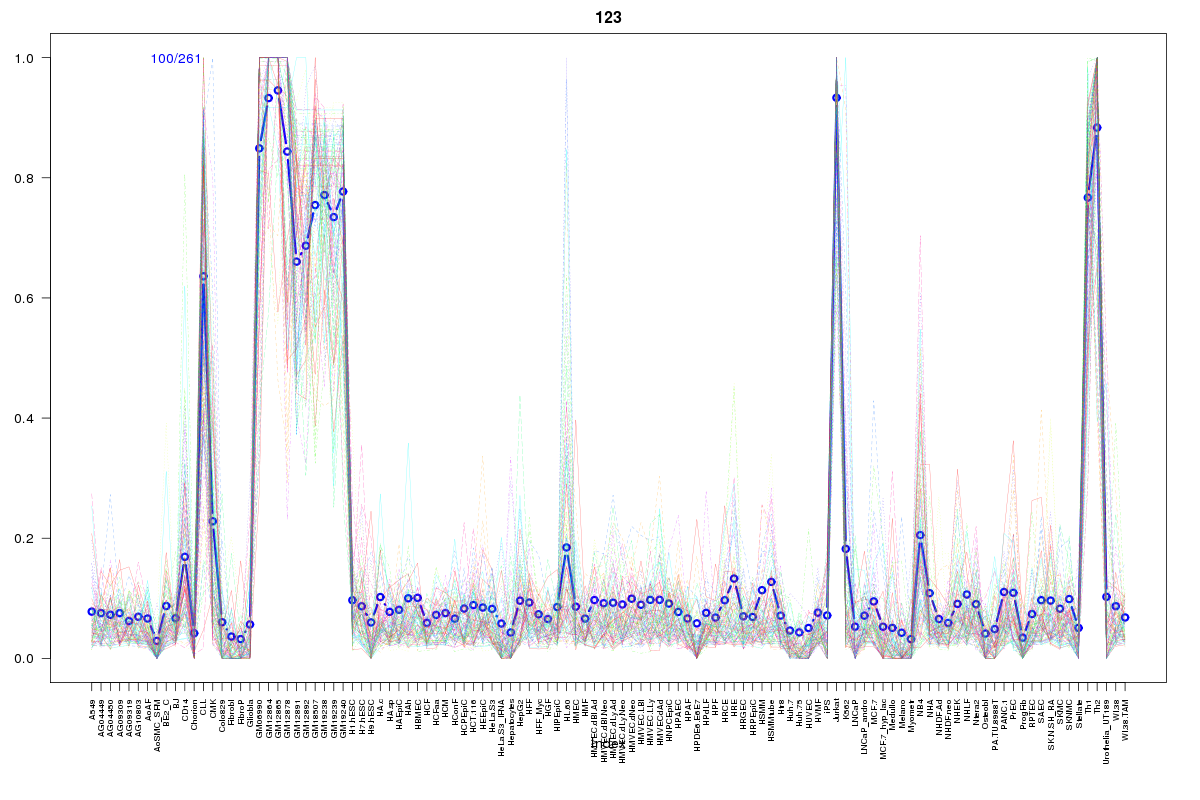 | 123 | 1 |
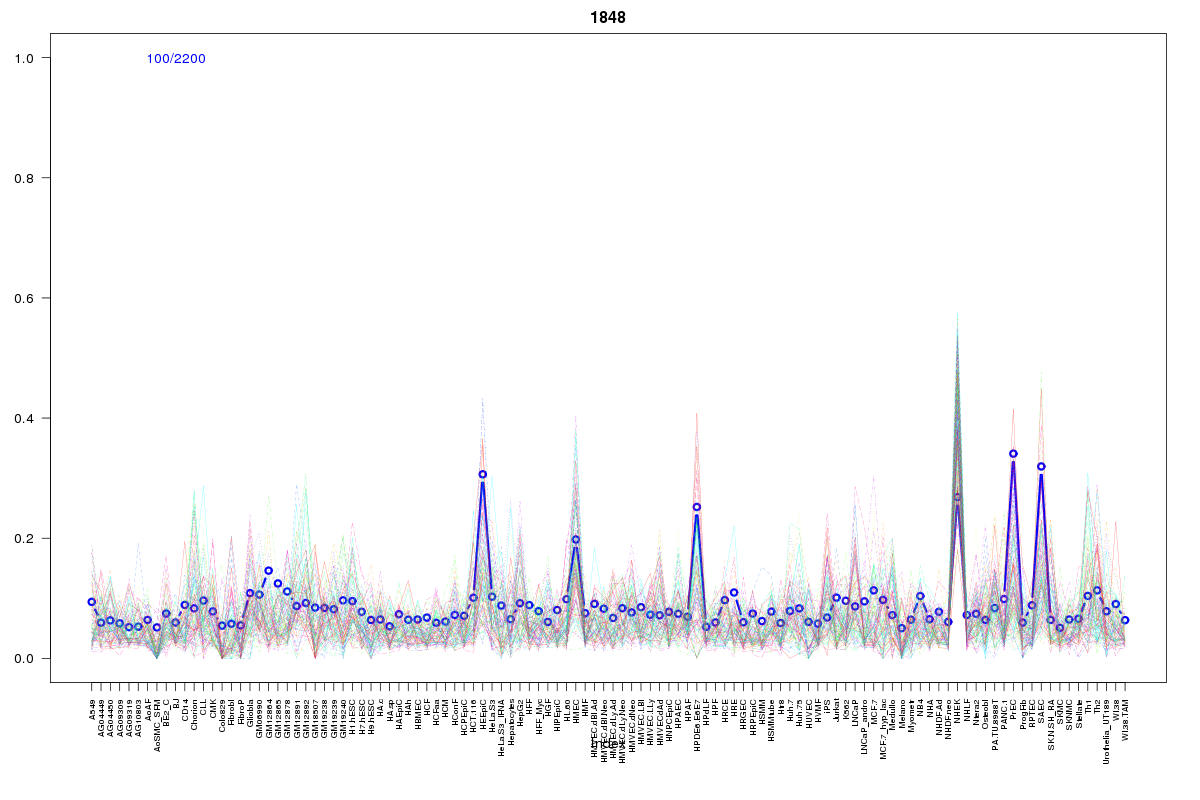 | 1848 | 1 |
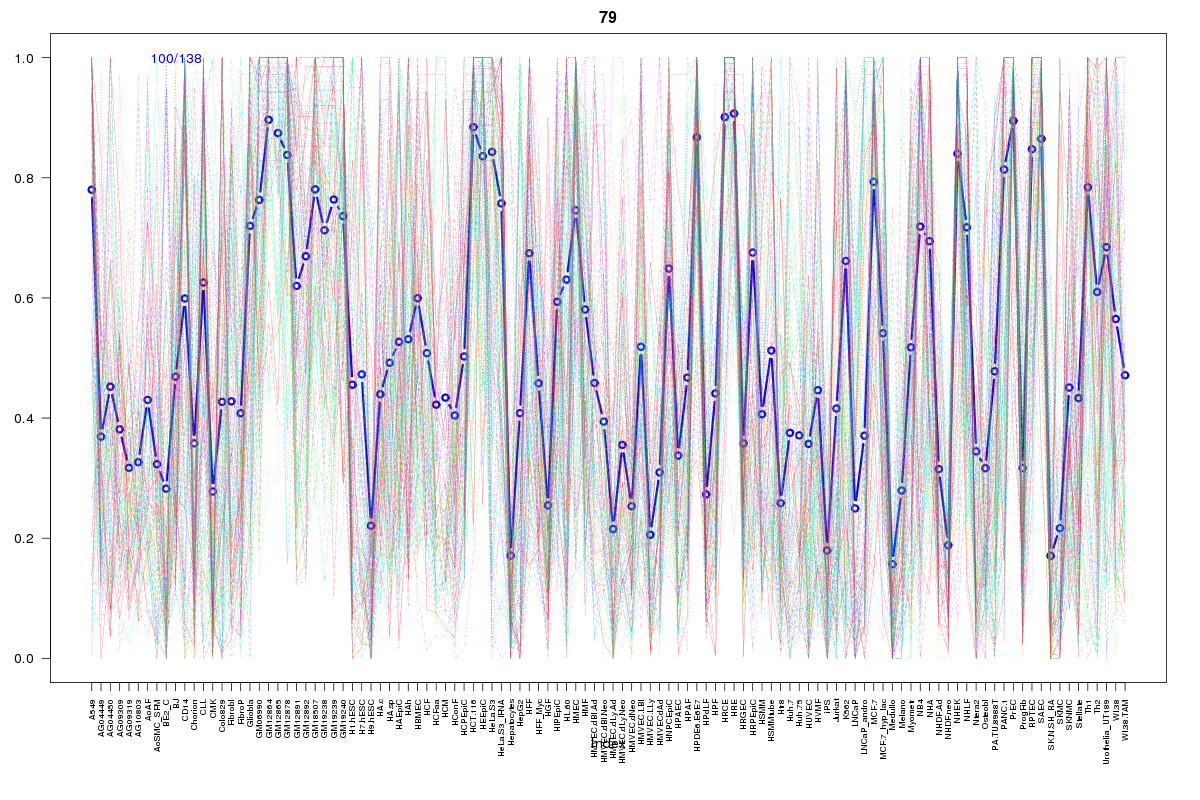 | 79 | 1 |
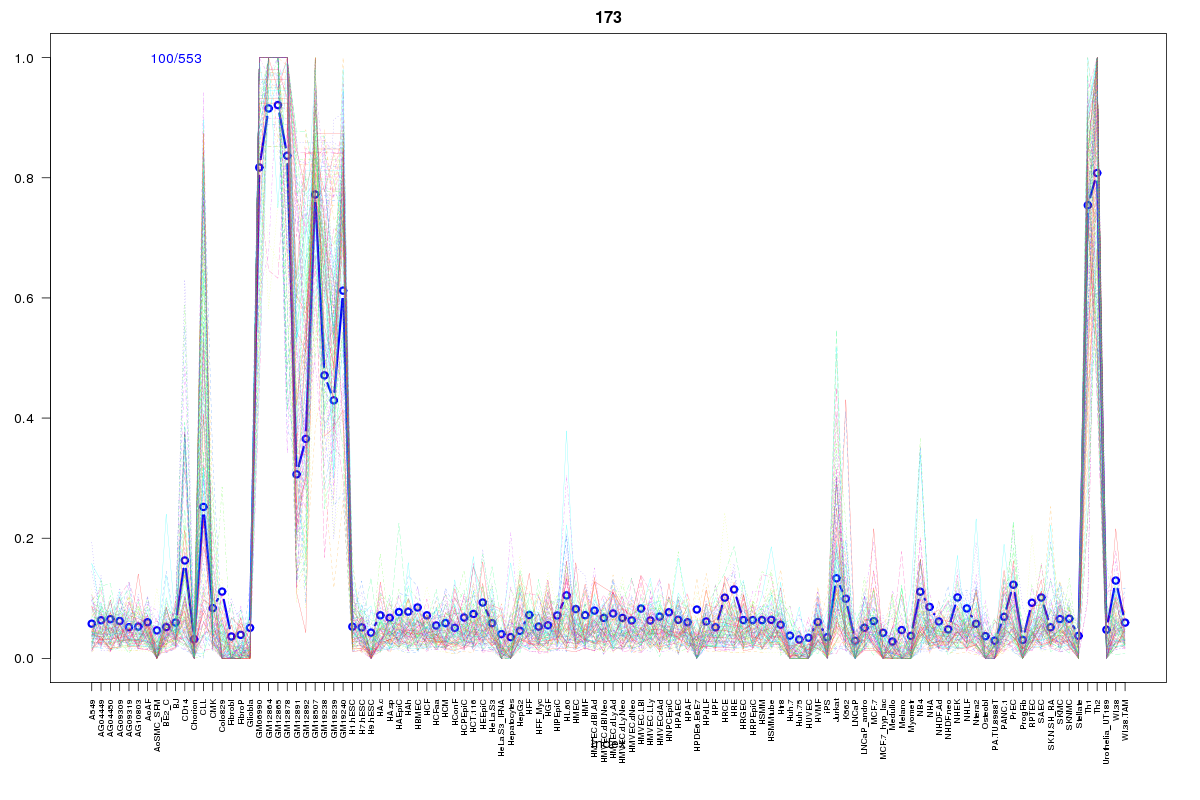 | 173 | 1 |
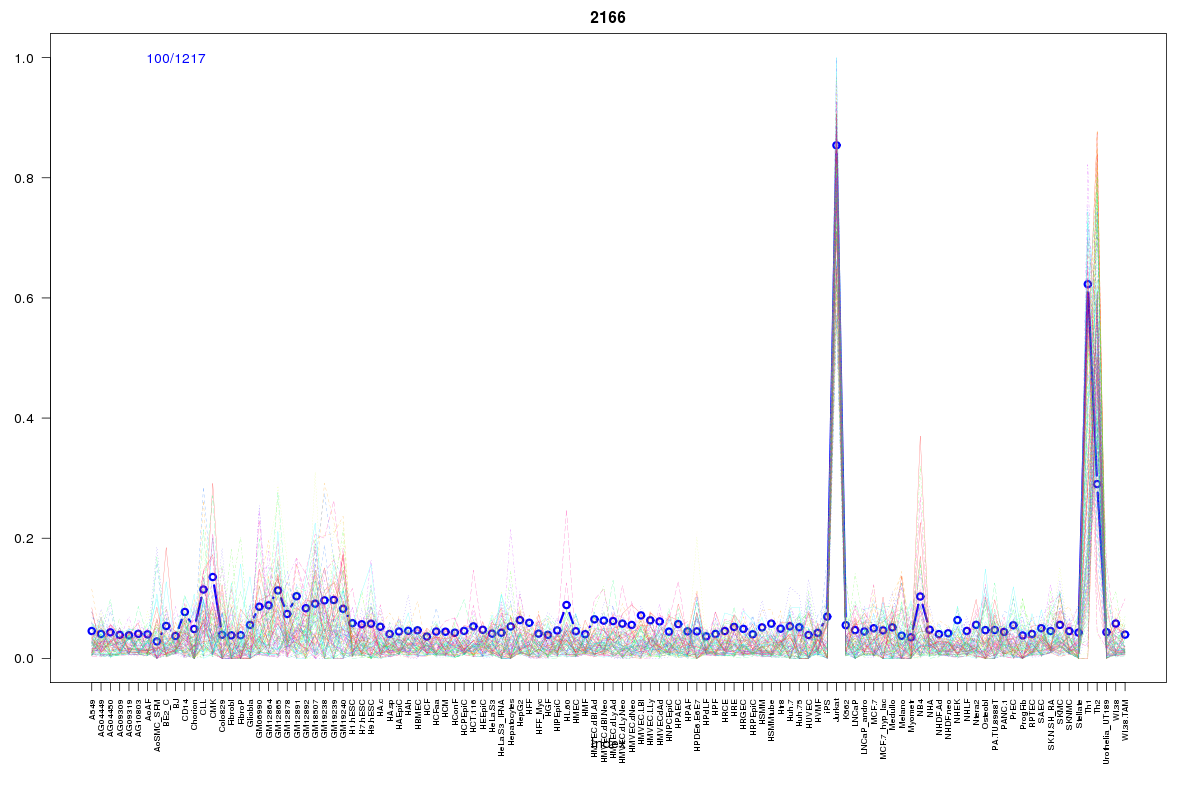 | 2166 | 1 |
 | 15 | 1 |
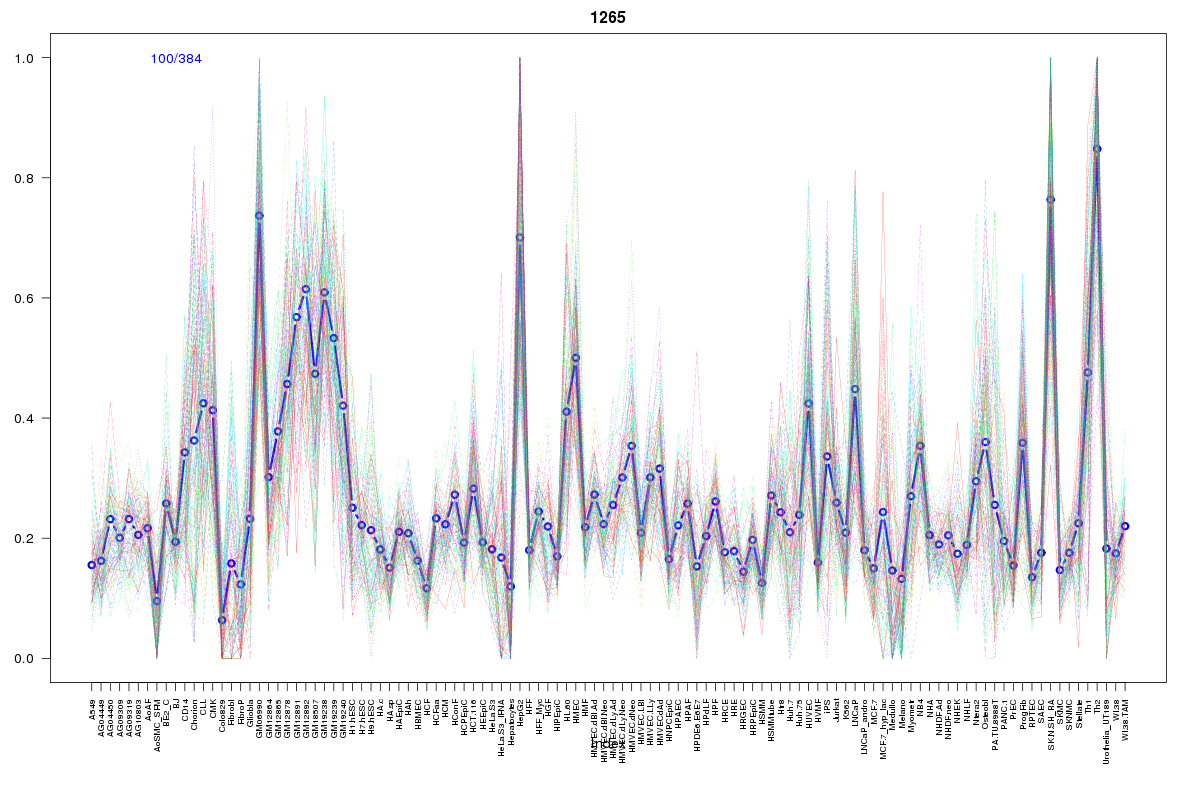 | 1265 | 1 |
Resources
BED file downloads
Connects to 49 DHS sitesTop 10 Correlated DHS Sites
p-values indiciate significant higher or lower correlation| Location | Cluster | P-value |
|---|---|---|
| chr1:28495960-28496110 | 126 | 0 |
| chr1:28526180-28526330 | 123 | 0 |
| chr1:28526520-28526670 | 173 | 0 |
| chr1:28474960-28475110 | 265 | 0.001 |
| chr1:28656220-28656370 | 2211 | 0.001 |
| chr1:28574860-28575010 | 1056 | 0.001 |
| chr1:28471100-28471250 | 79 | 0.002 |
| chr1:28474500-28474650 | 217 | 0.002 |
| chr1:28474320-28474470 | 265 | 0.002 |
| chr1:28559205-28559355 | 1404 | 0.002 |
| chr1:28571480-28571630 | 121 | 0.002 |
External Databases
UCSCEnsembl (ENSG00000130770)