Gene: PTAFR
chr1: 28473676-28520447Expression Profile
(log scale)
Graphical Connections
Distribution of linked clusters:
You may find it interesting if many of the connected DHS sites belong to the same cluster.| Cluster Profile | Cluster ID | Number of DHS sites in this cluster |
|---|---|---|
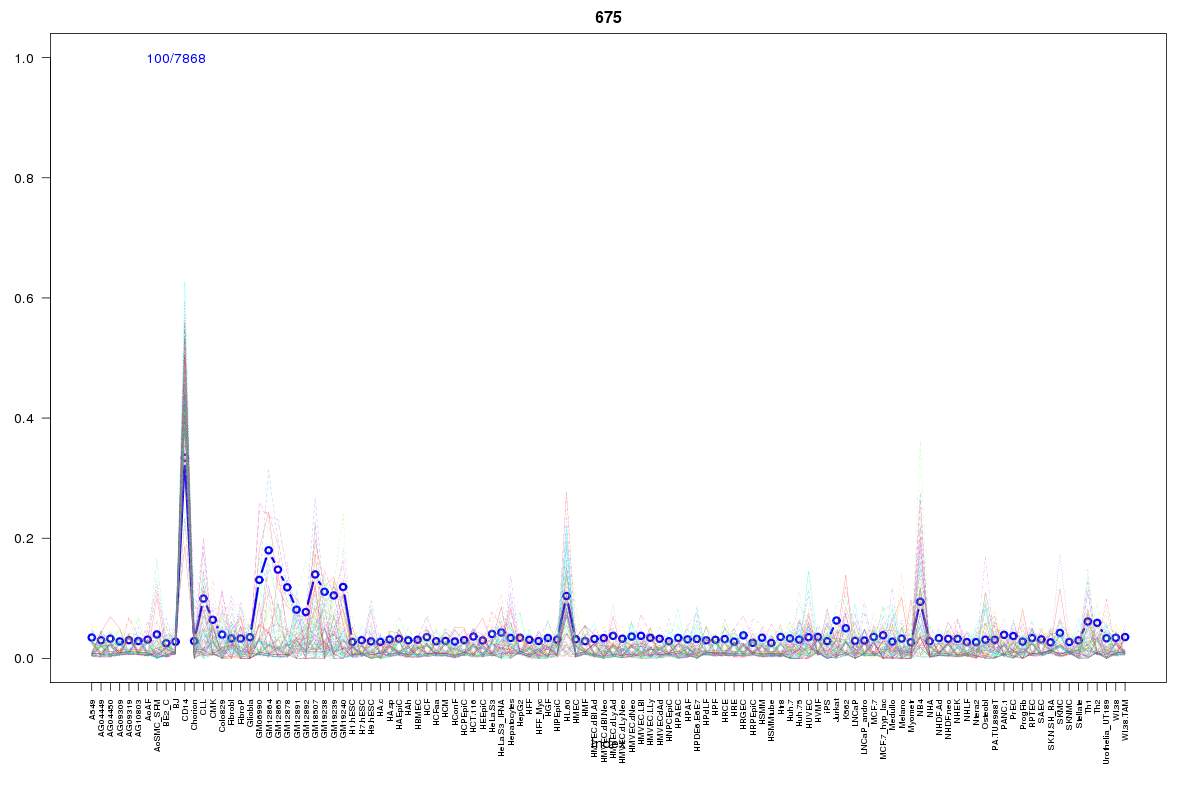 | 675 | 4 |
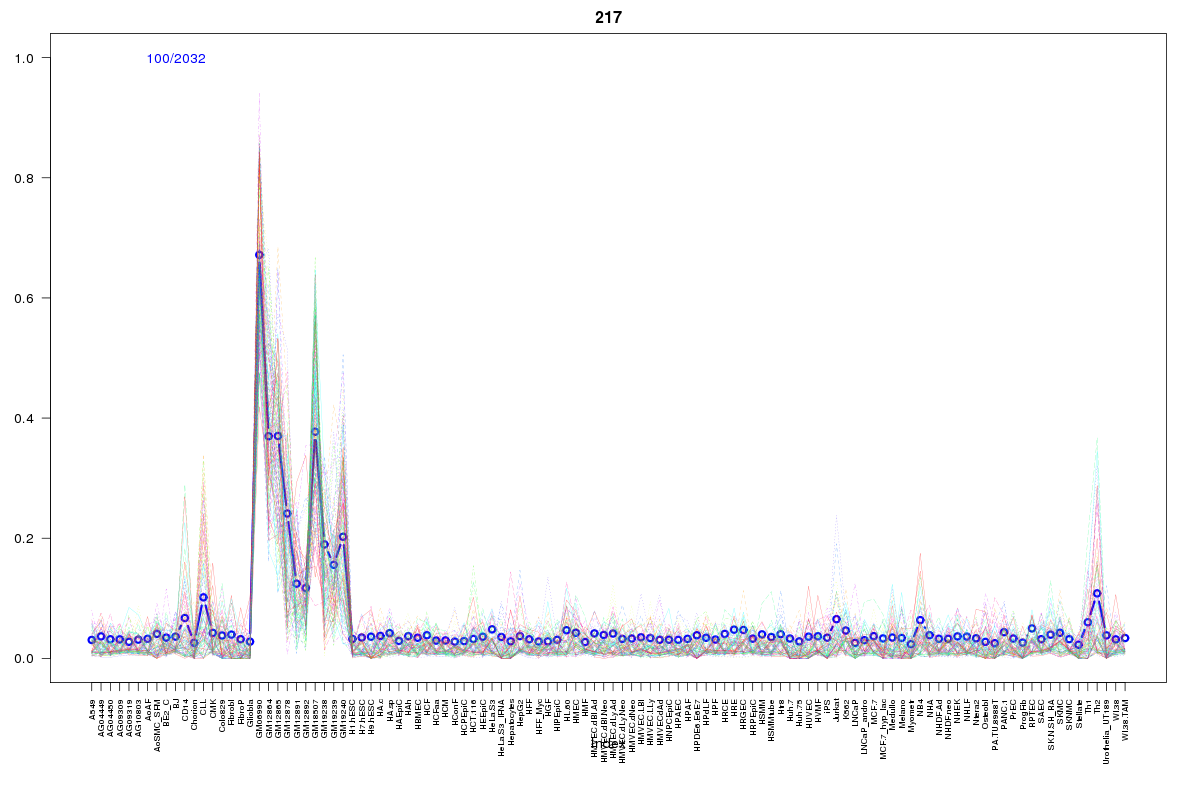 | 217 | 4 |
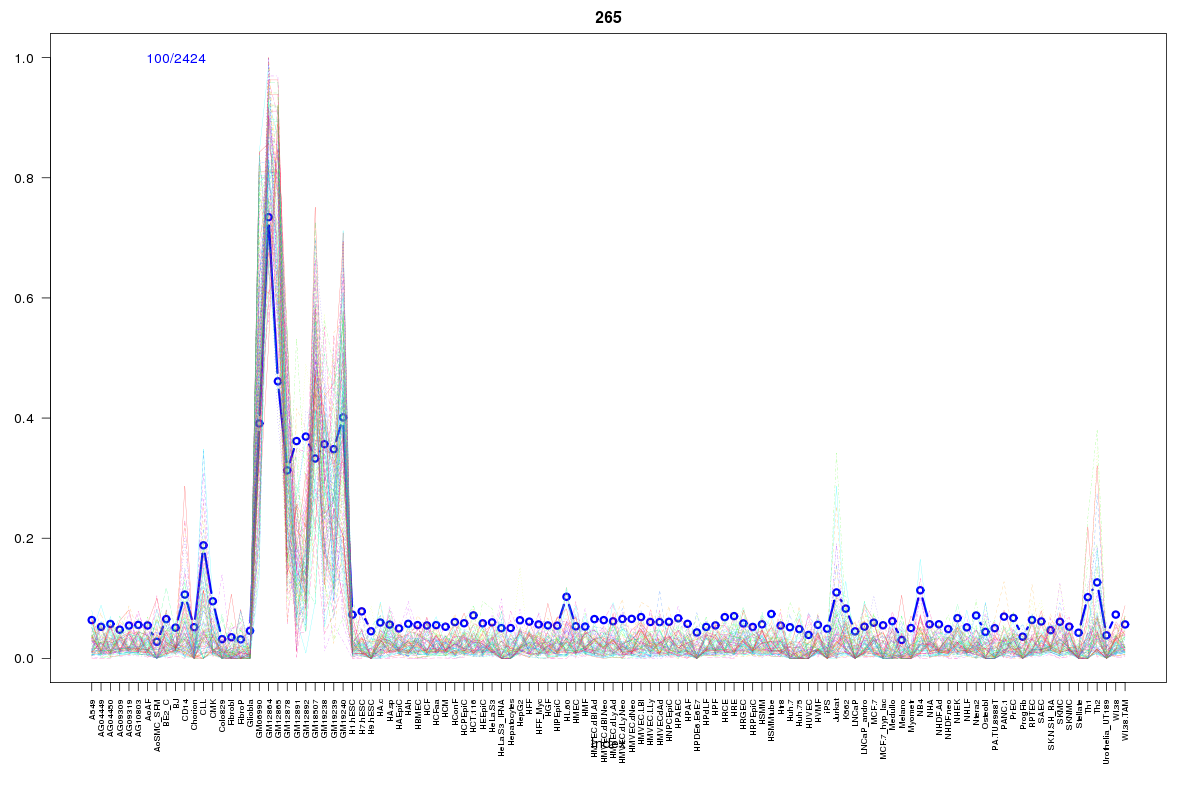 | 265 | 3 |
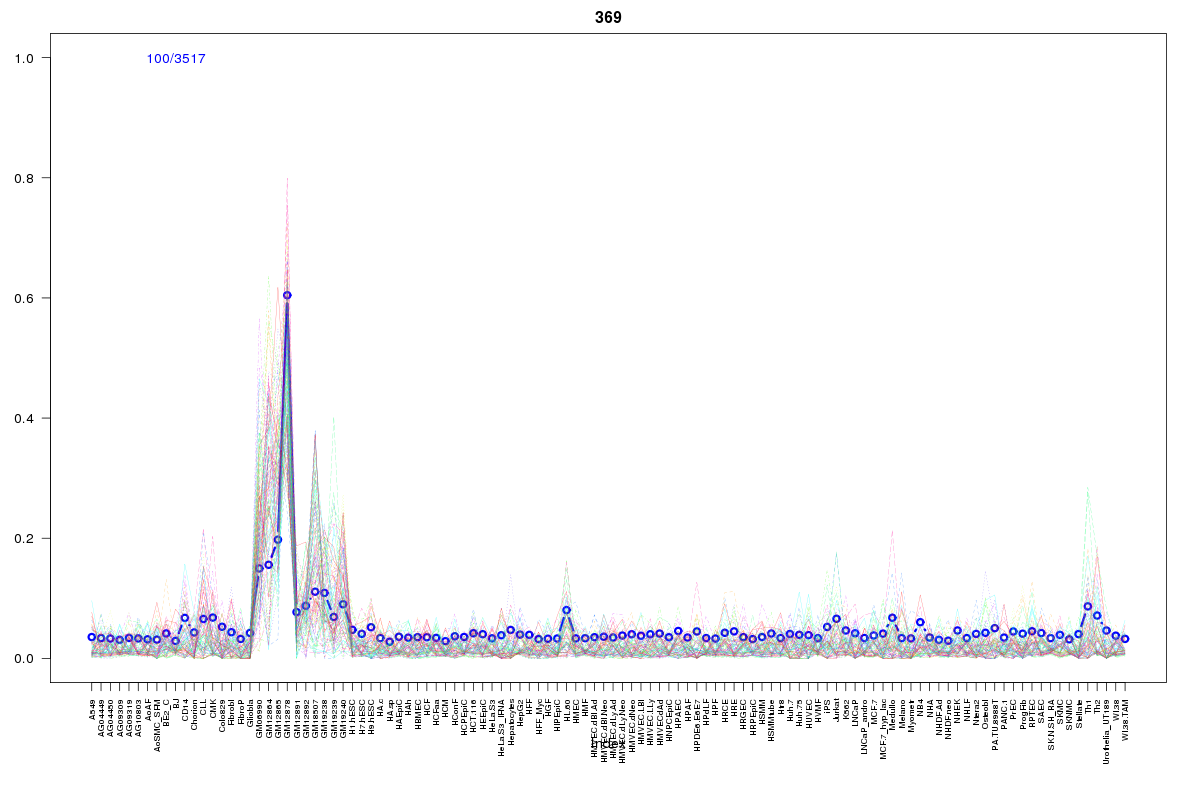 | 369 | 3 |
 | 626 | 2 |
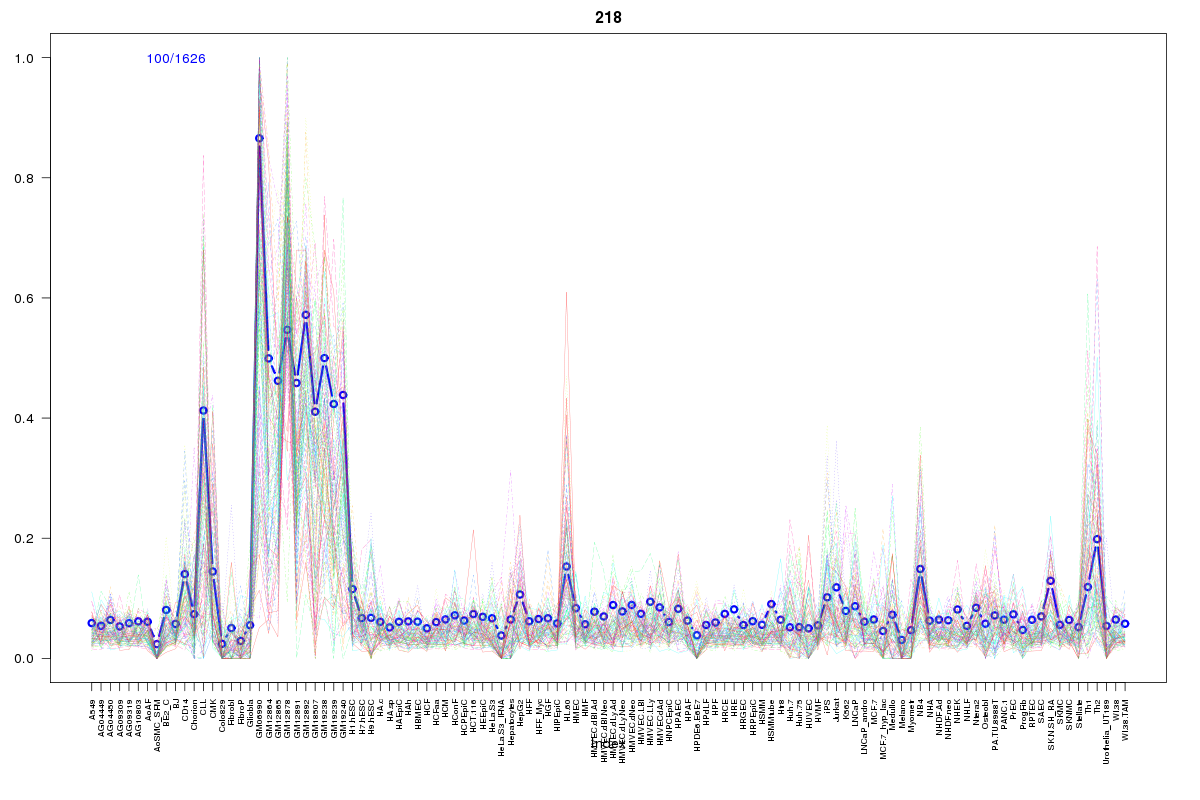 | 218 | 2 |
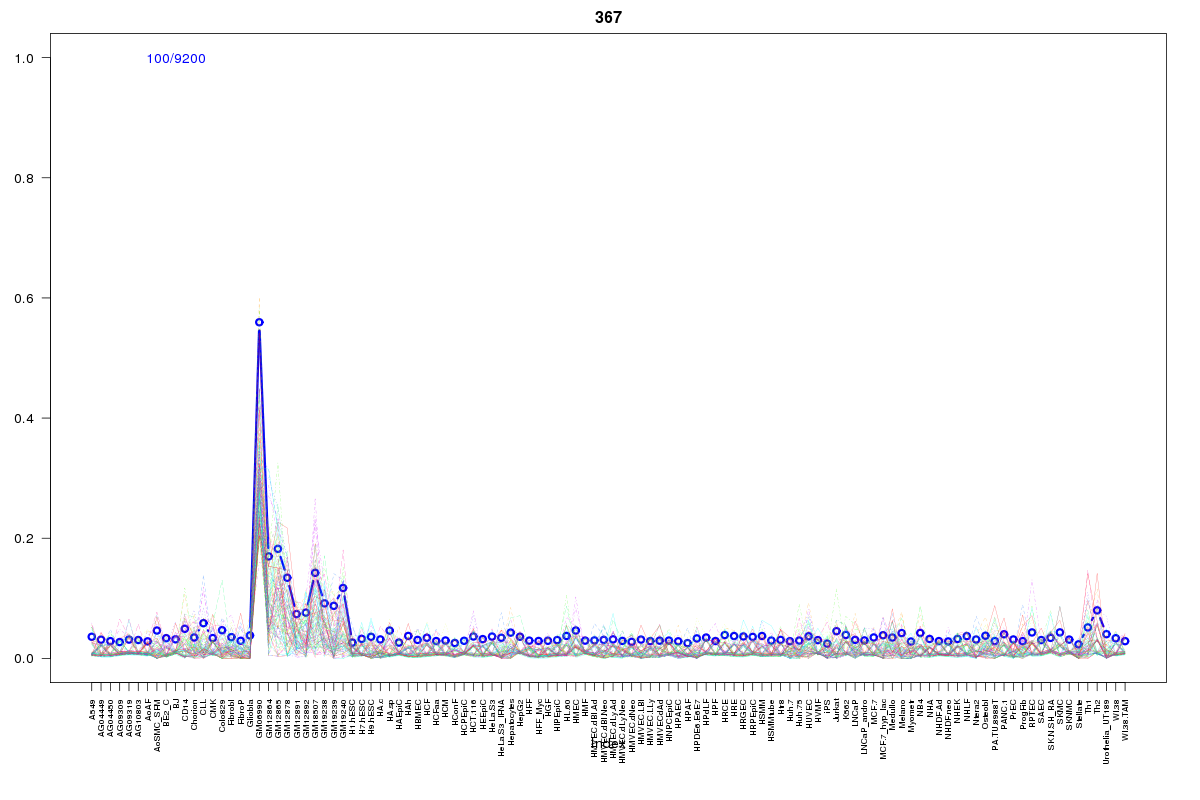 | 367 | 2 |
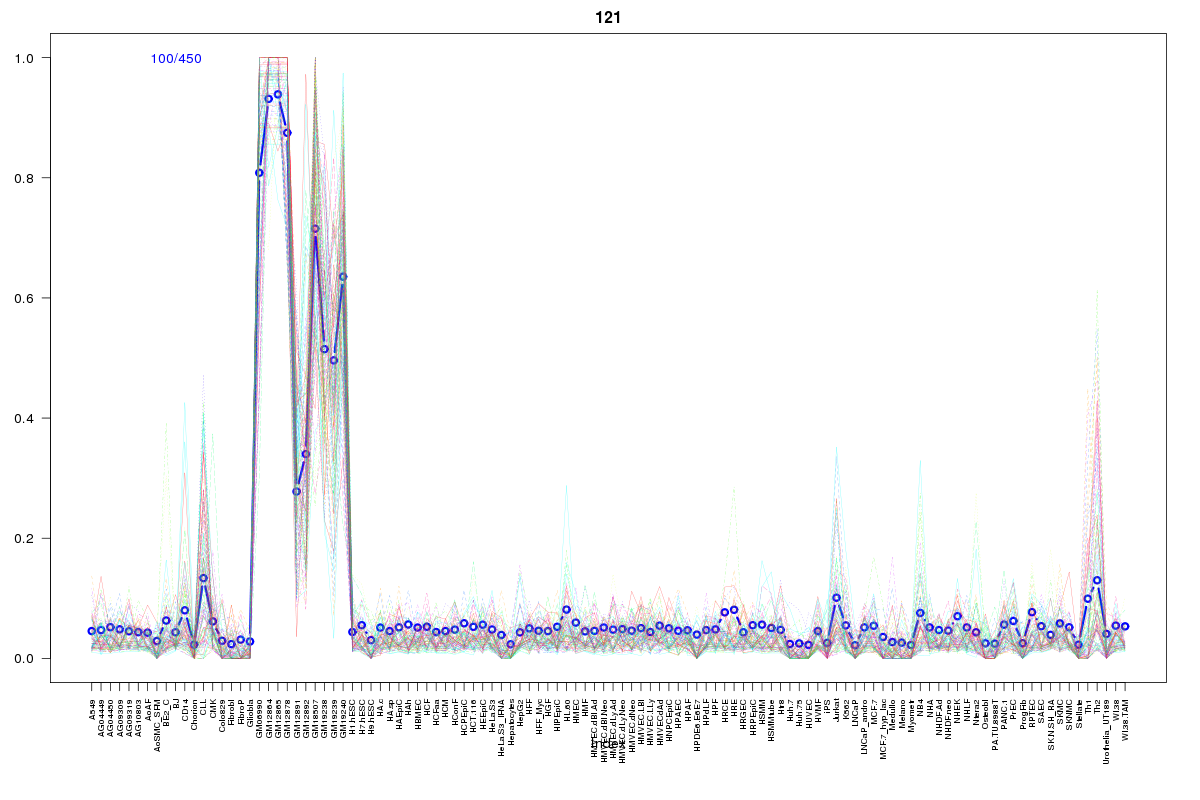 | 121 | 2 |
 | 430 | 2 |
 | 133 | 1 |
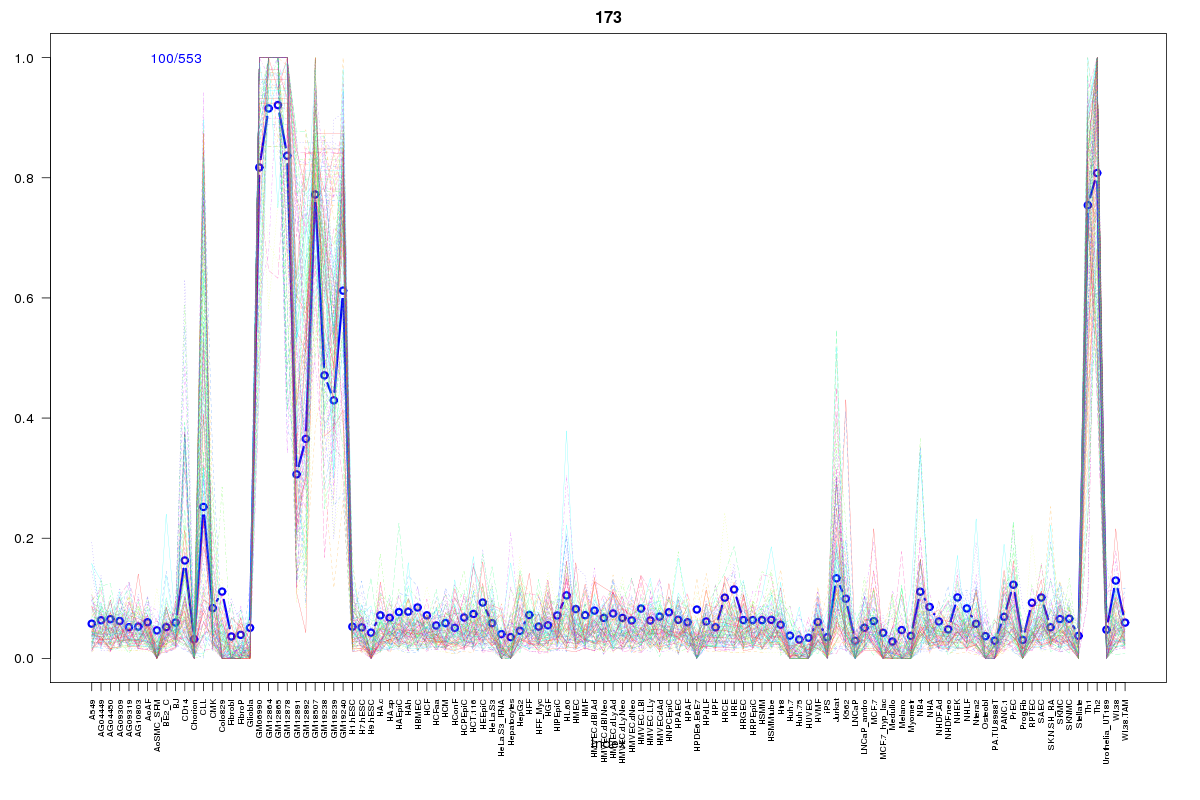 | 173 | 1 |
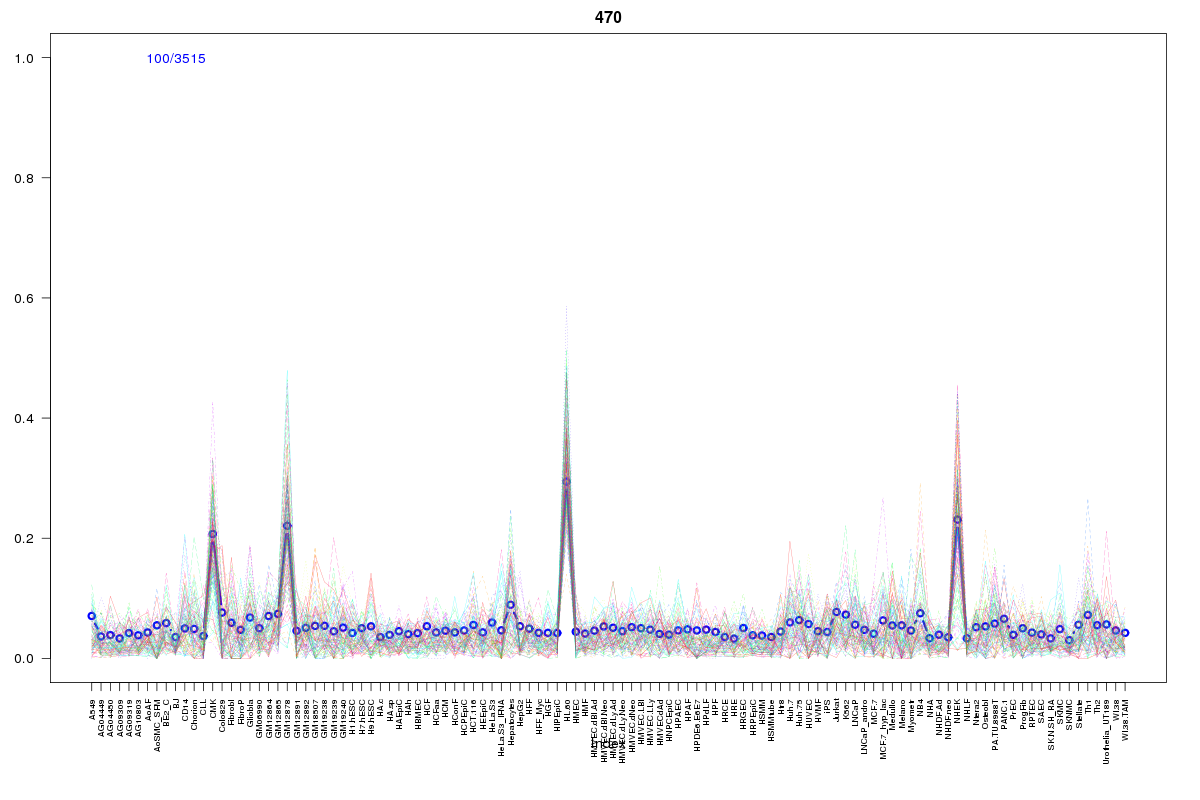 | 470 | 1 |
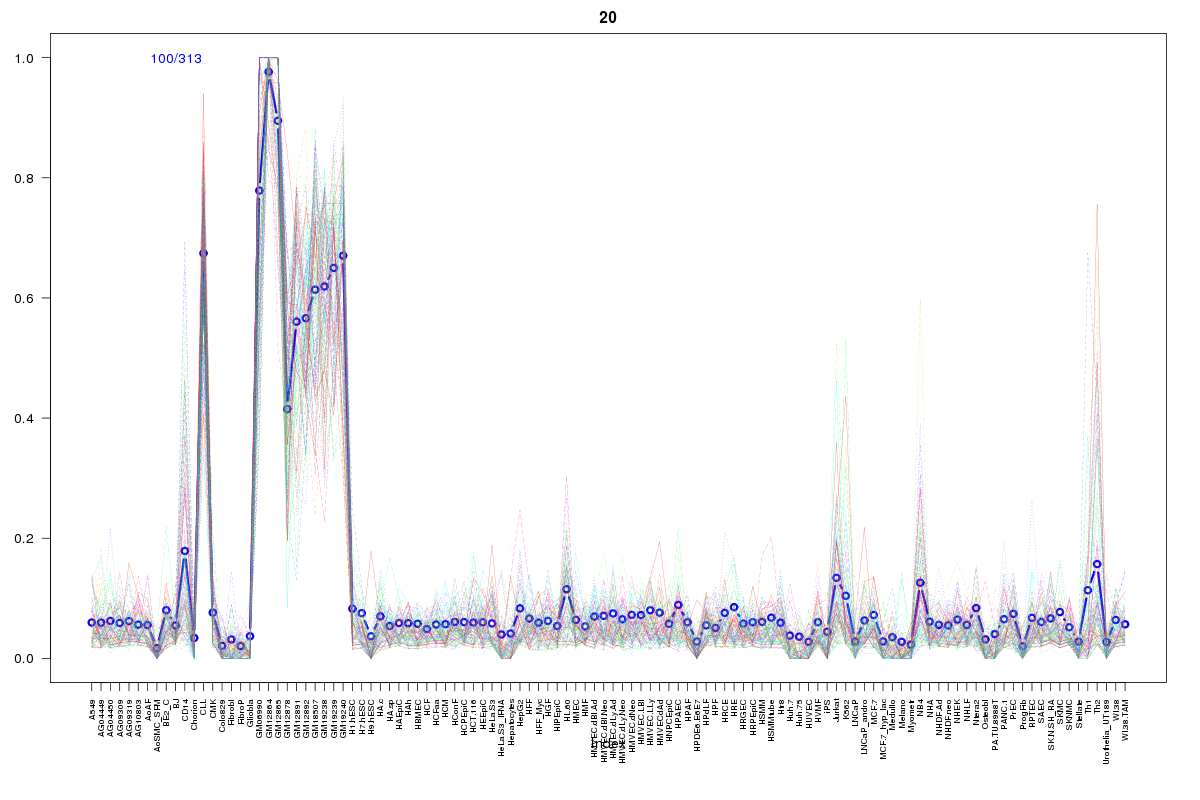 | 20 | 1 |
 | 629 | 1 |
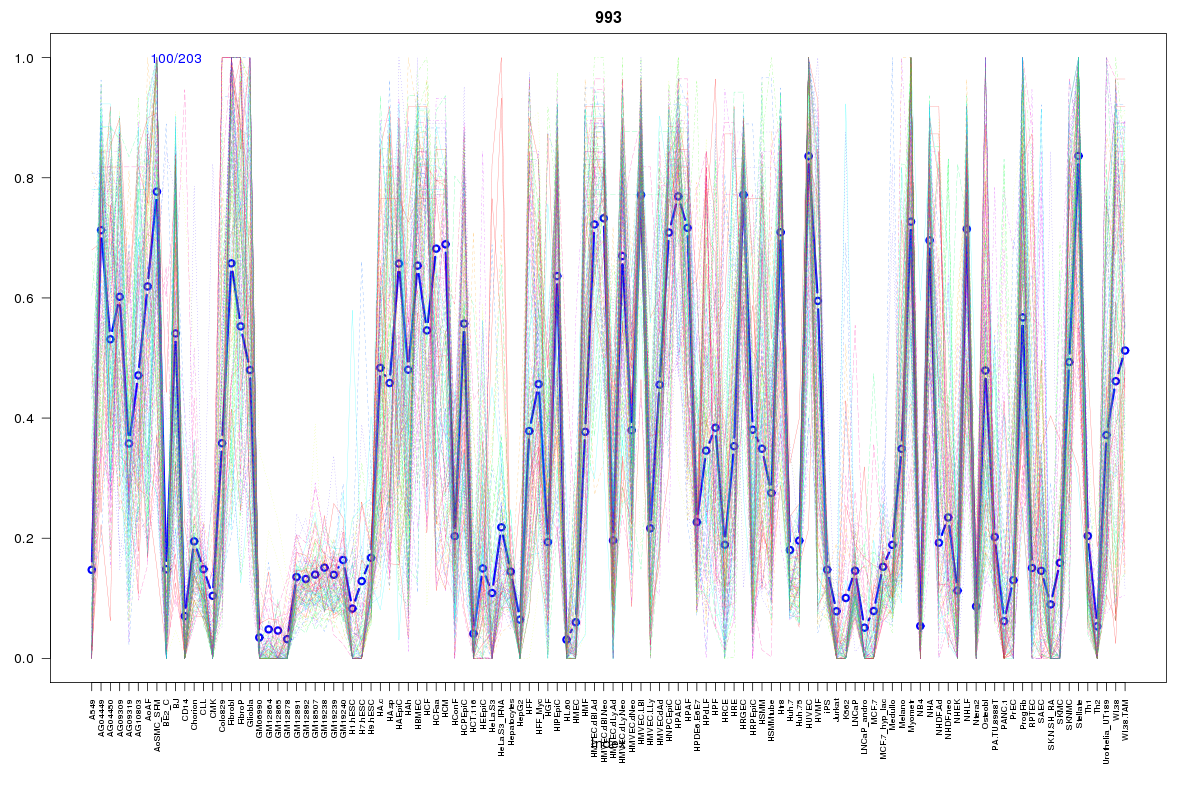 | 993 | 1 |
 | 1404 | 1 |
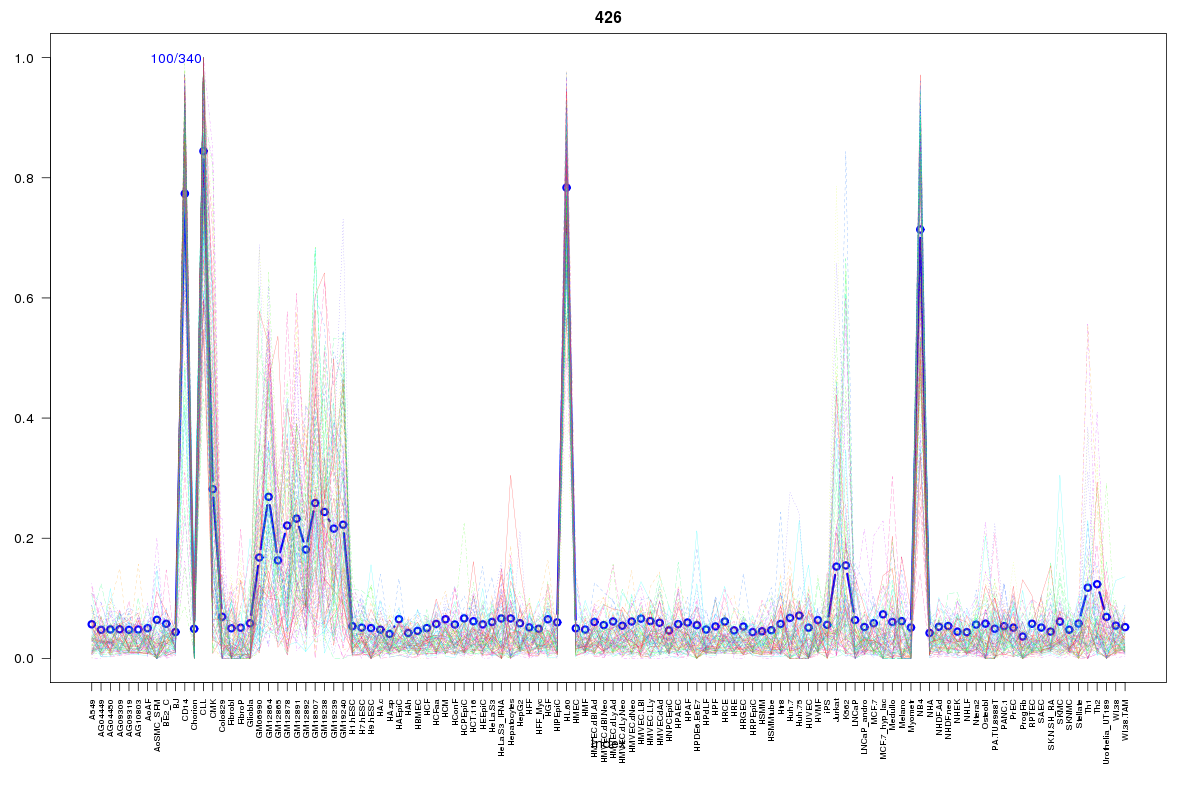 | 426 | 1 |
 | 568 | 1 |
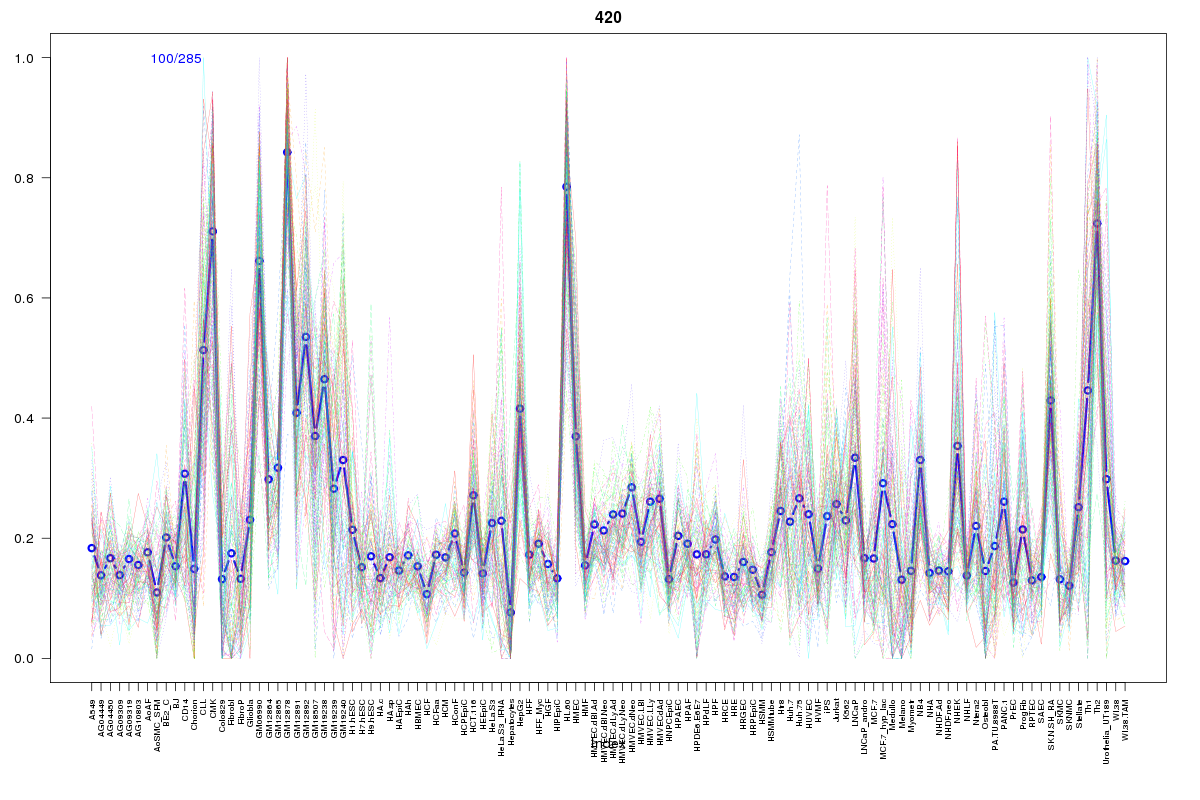 | 420 | 1 |
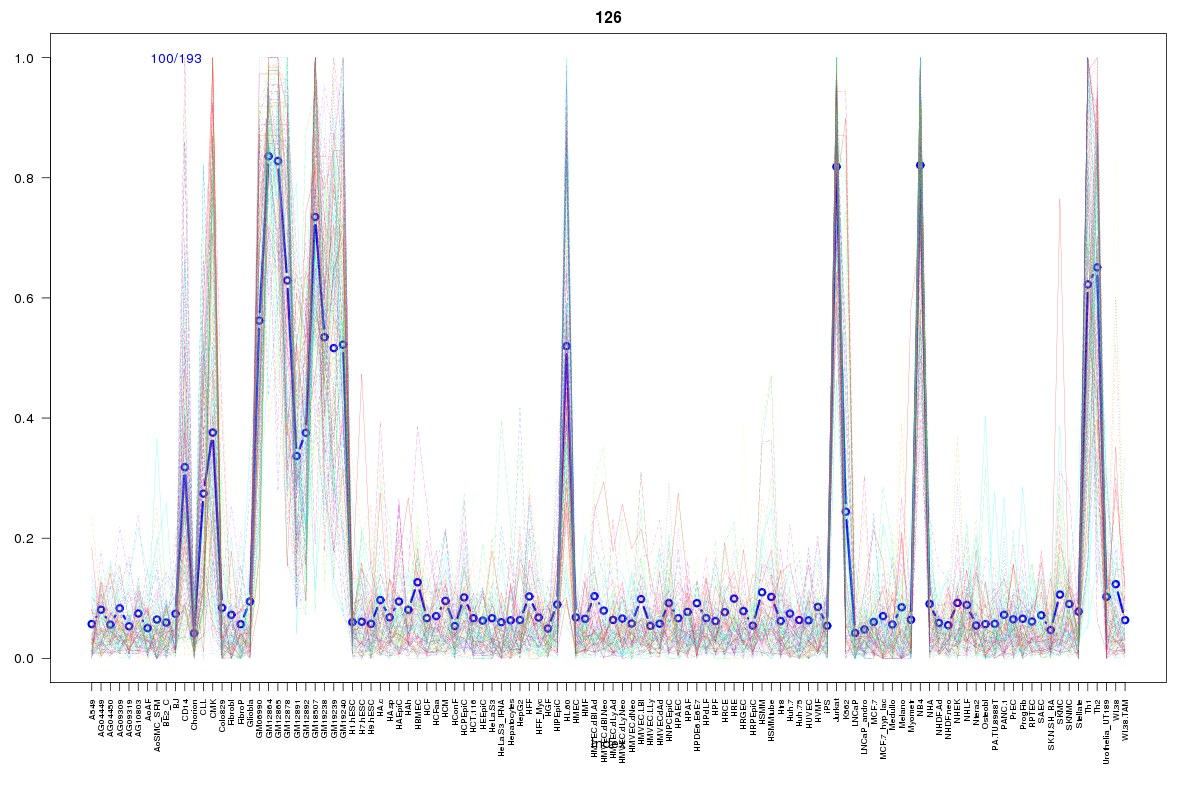 | 126 | 1 |
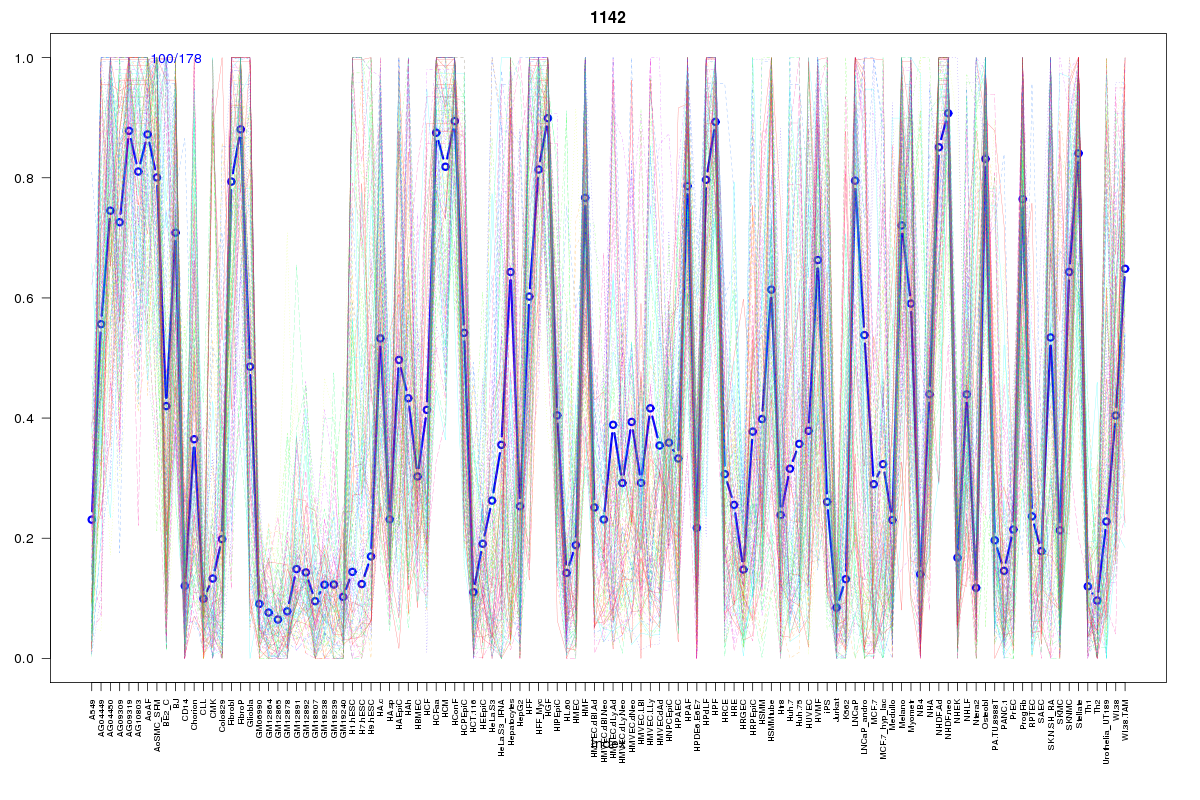 | 1142 | 1 |
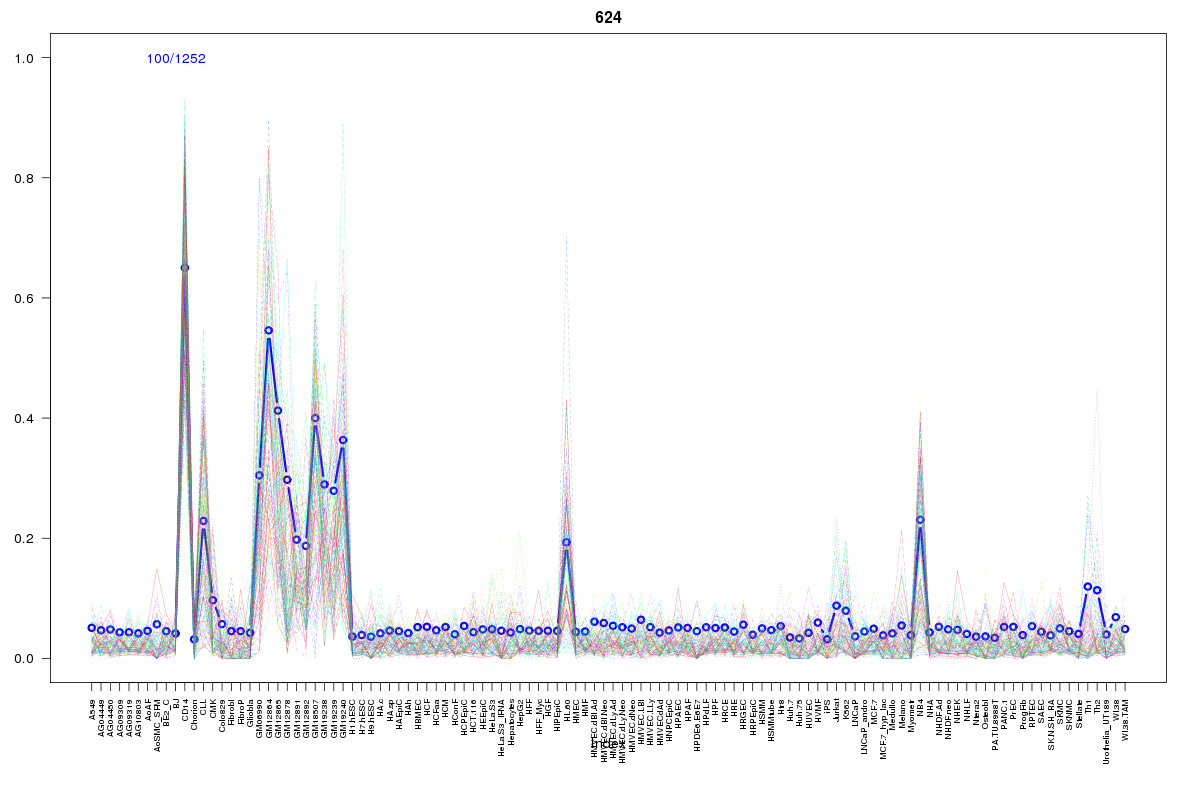 | 624 | 1 |
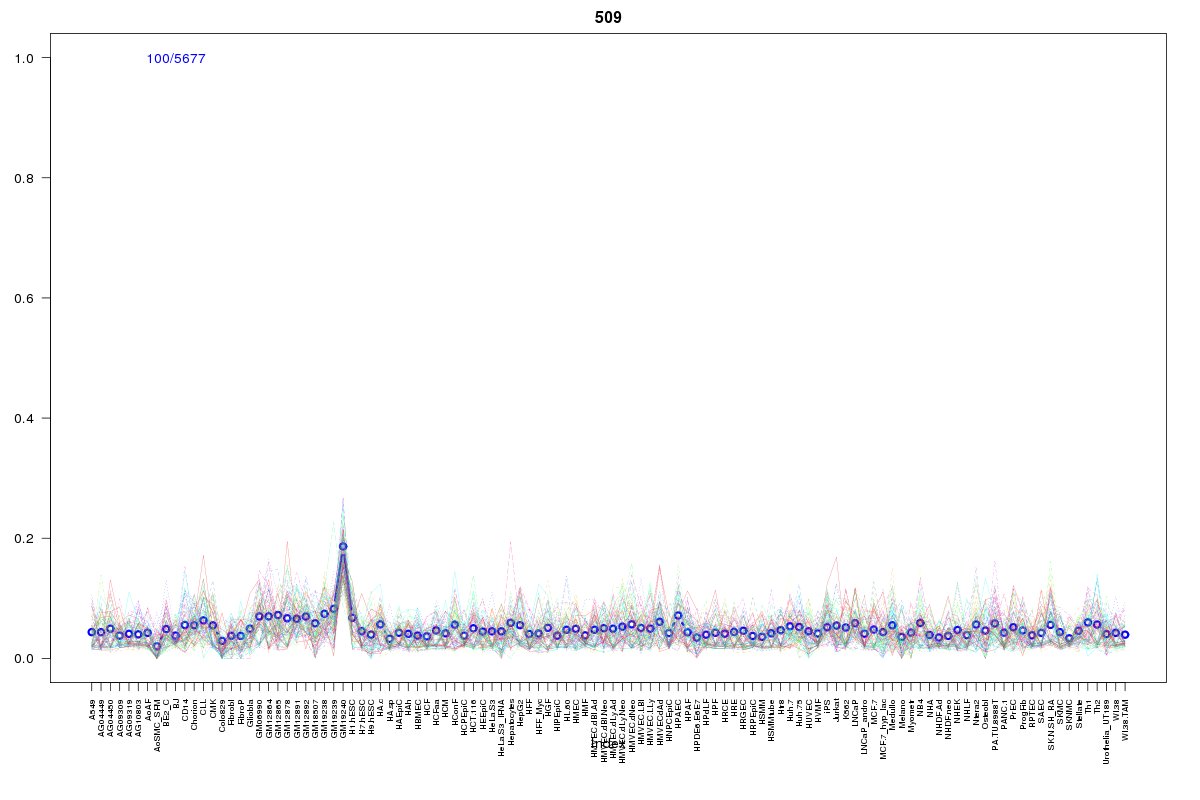 | 509 | 1 |
 | 1056 | 1 |
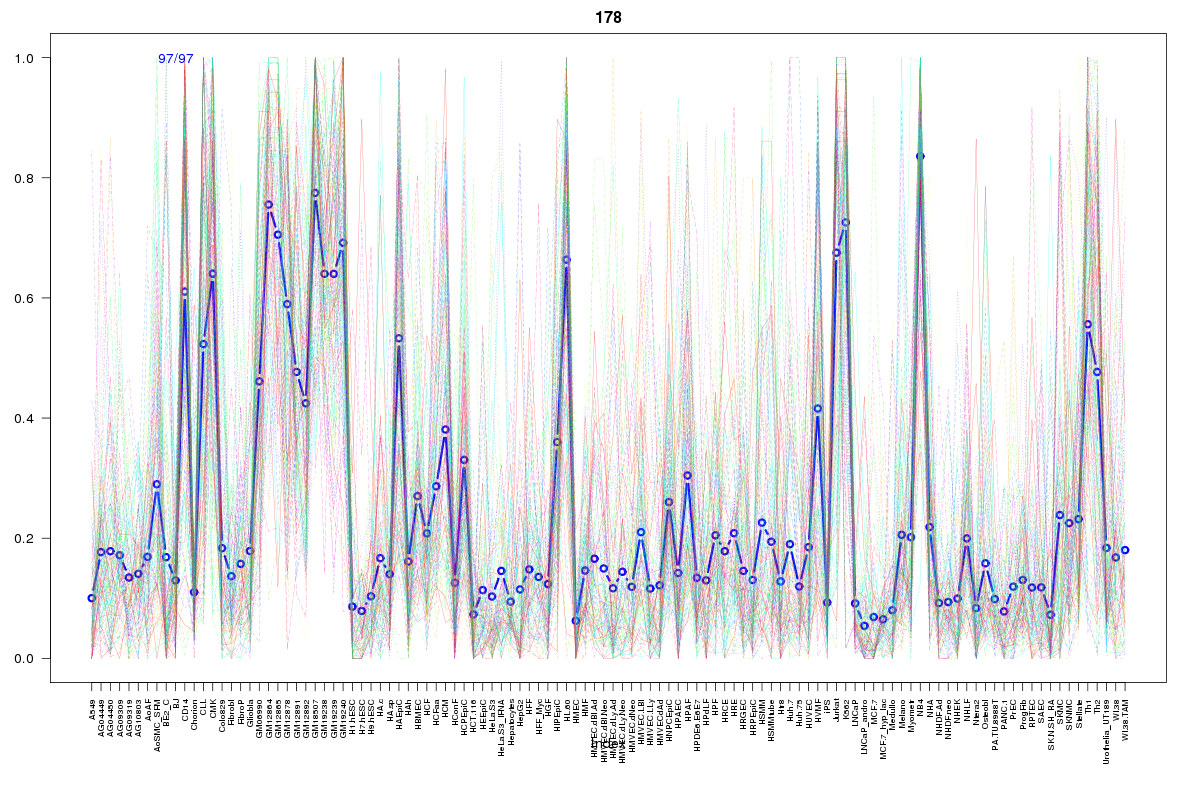 | 178 | 1 |
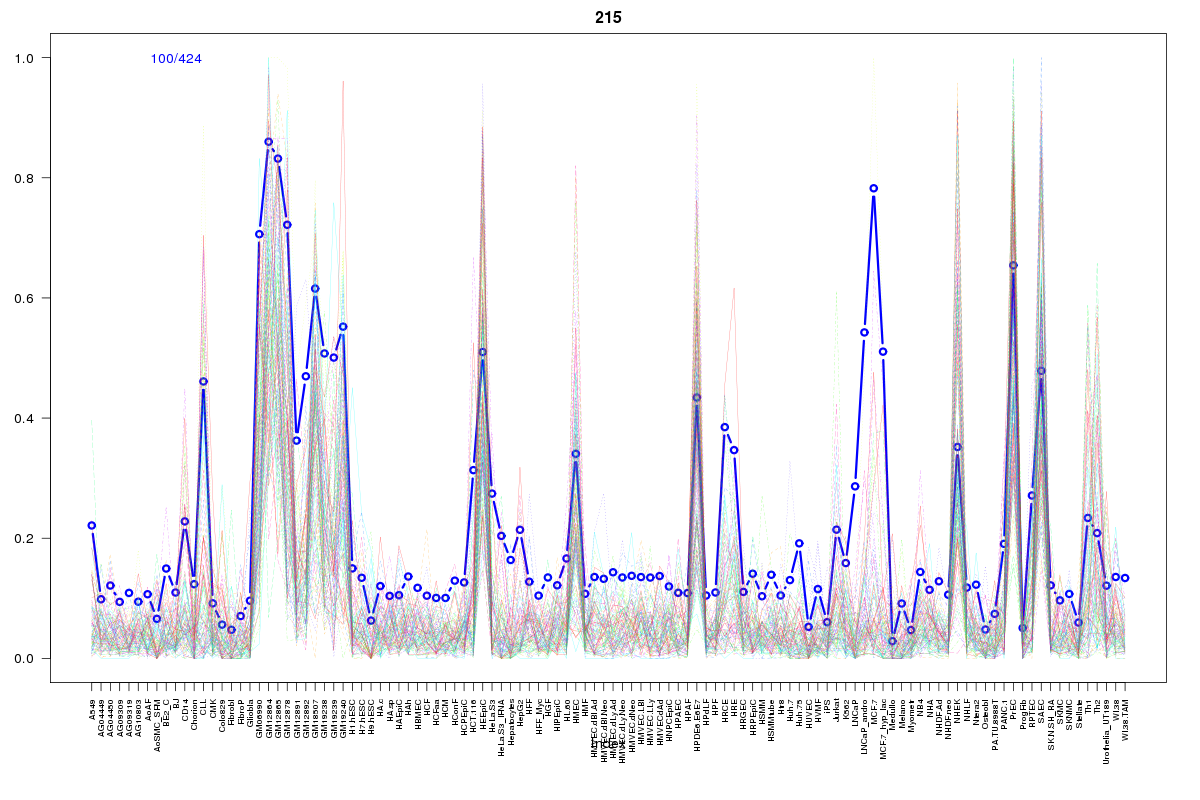 | 215 | 1 |
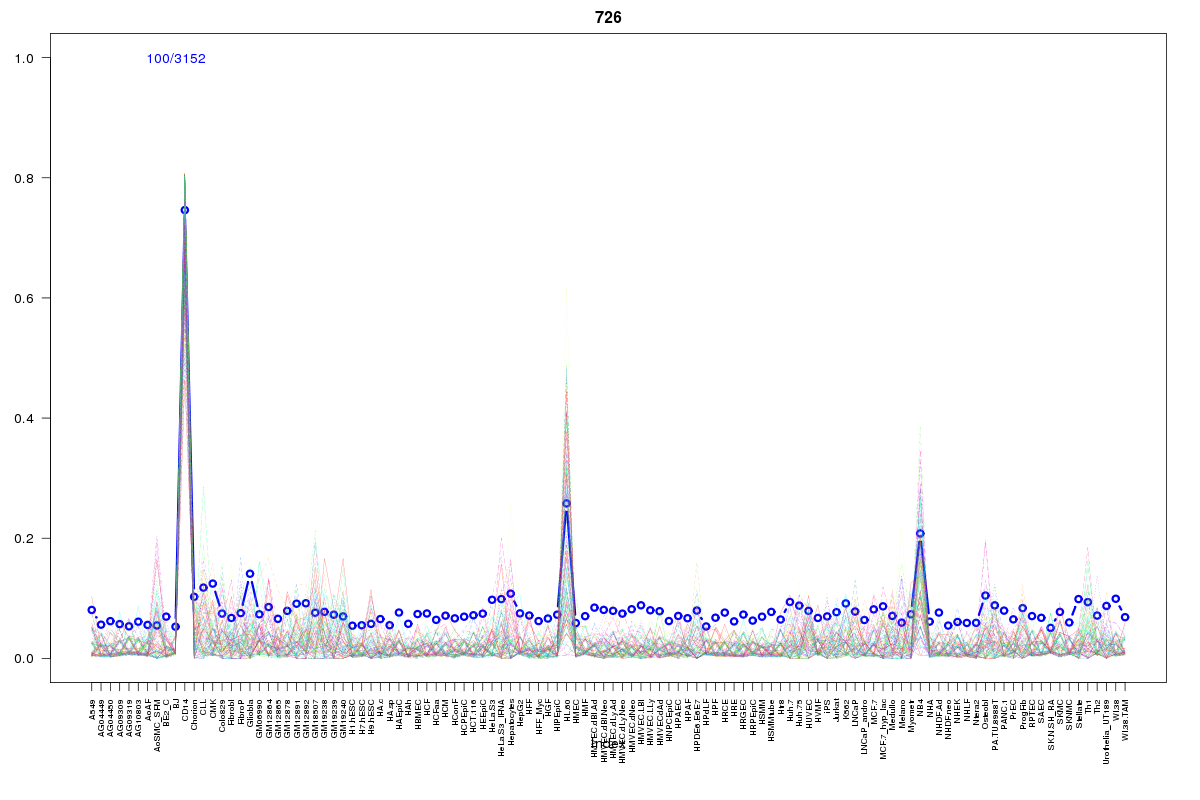 | 726 | 1 |
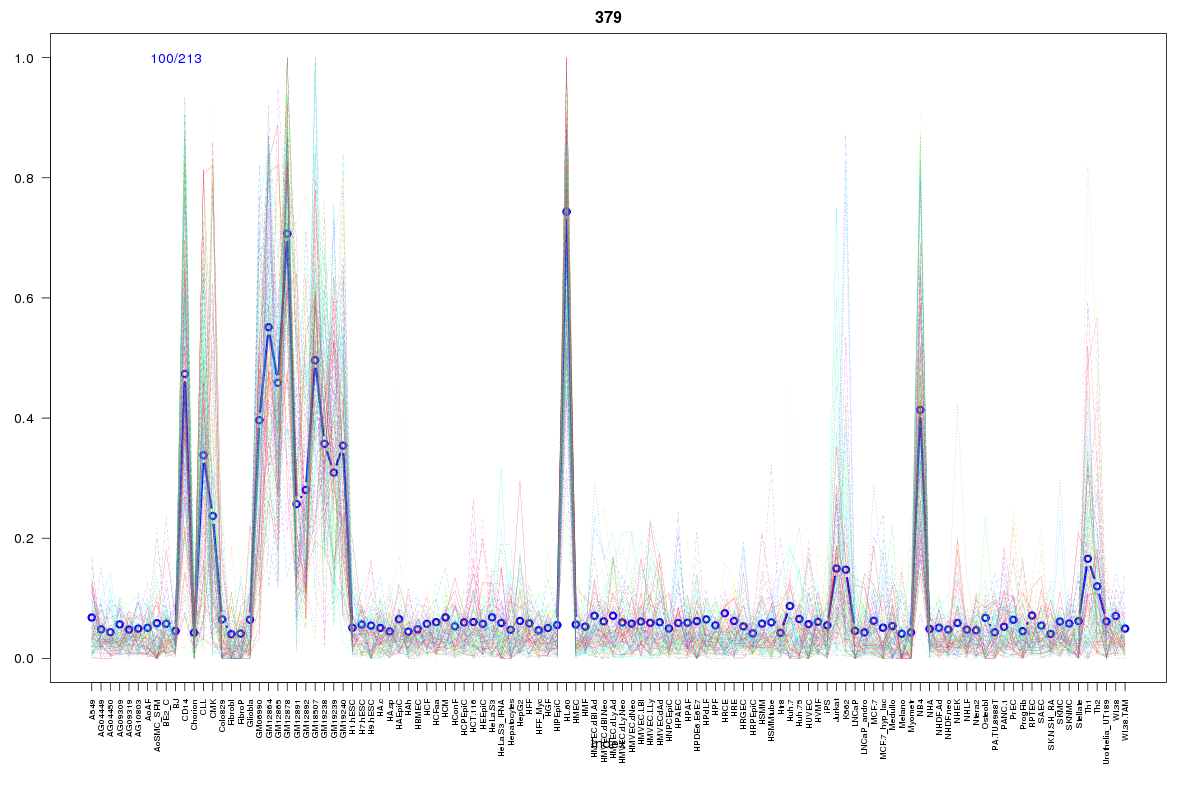 | 379 | 1 |
 | 274 | 1 |
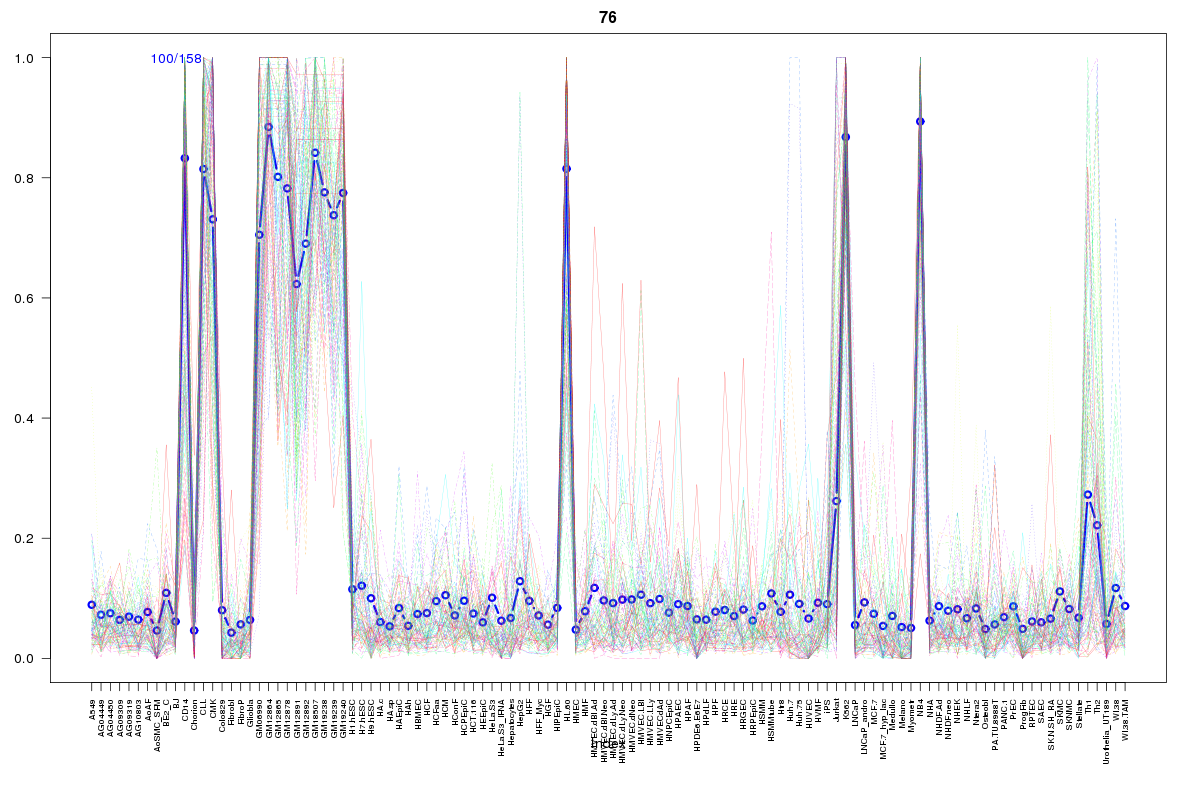 | 76 | 1 |
 | 220 | 1 |
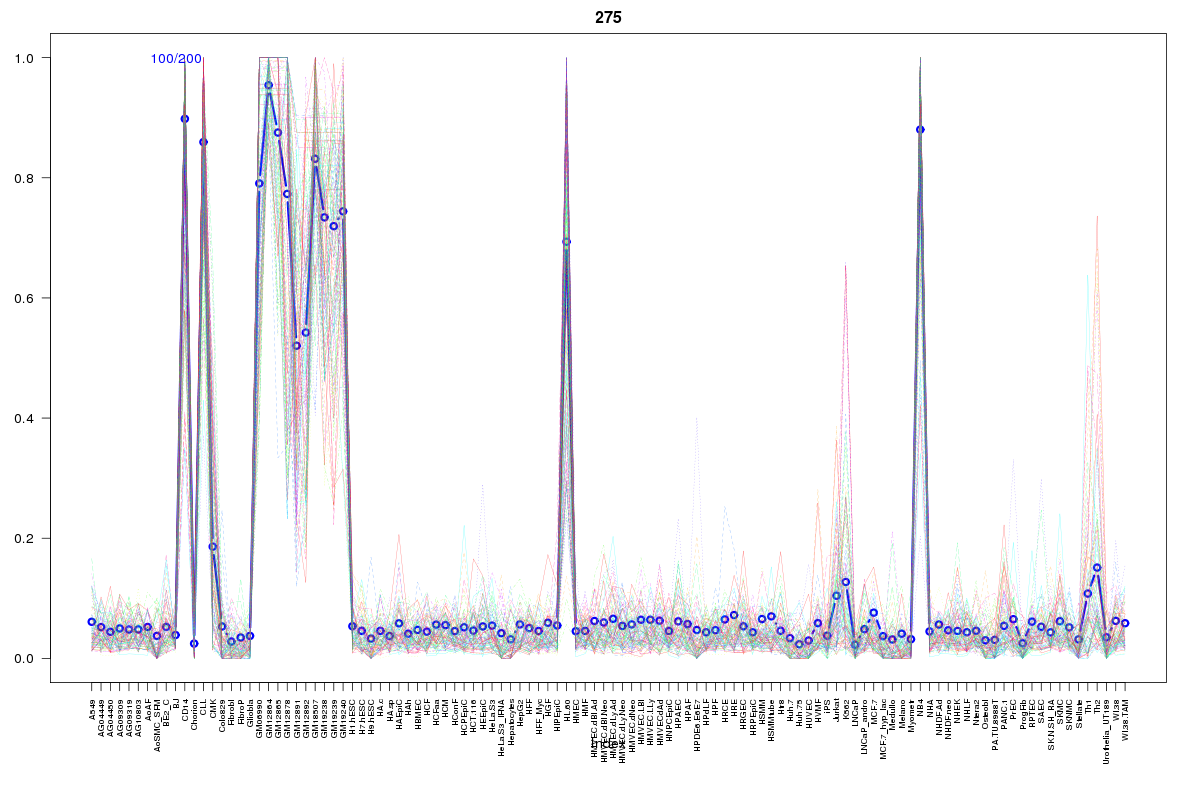 | 275 | 1 |
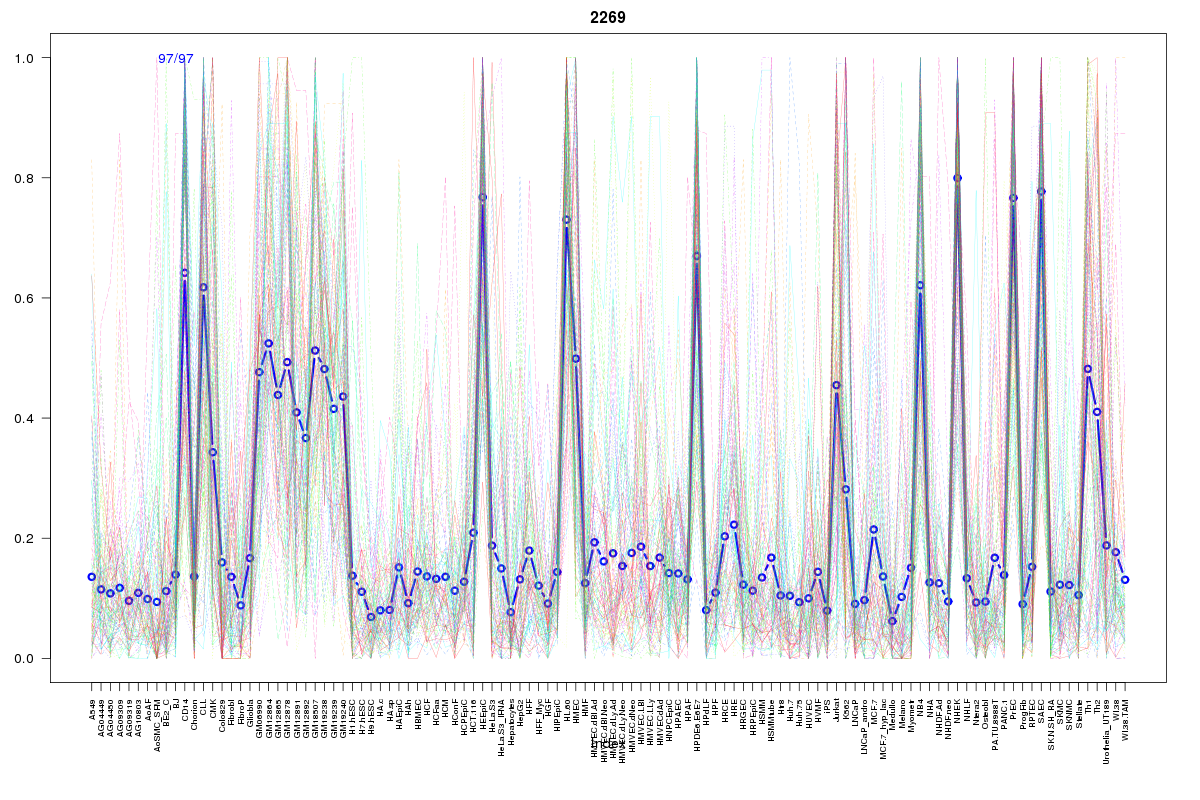 | 2269 | 1 |
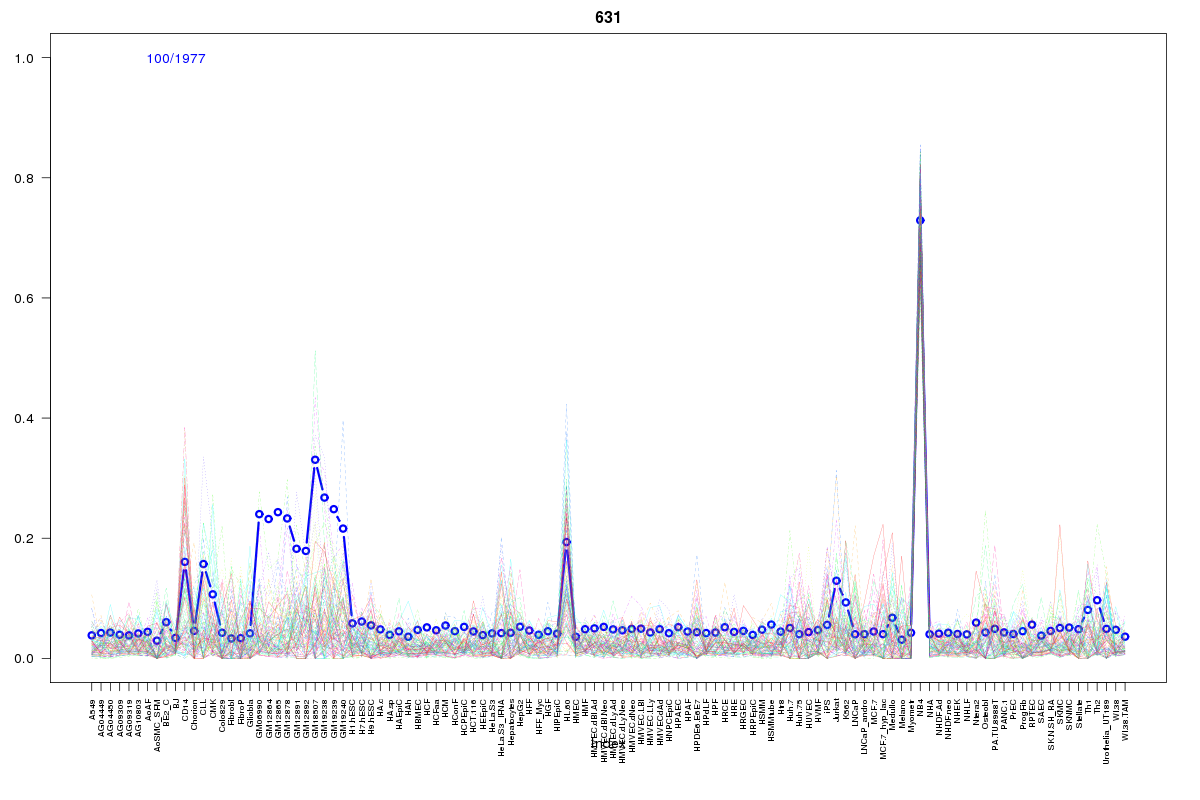 | 631 | 1 |
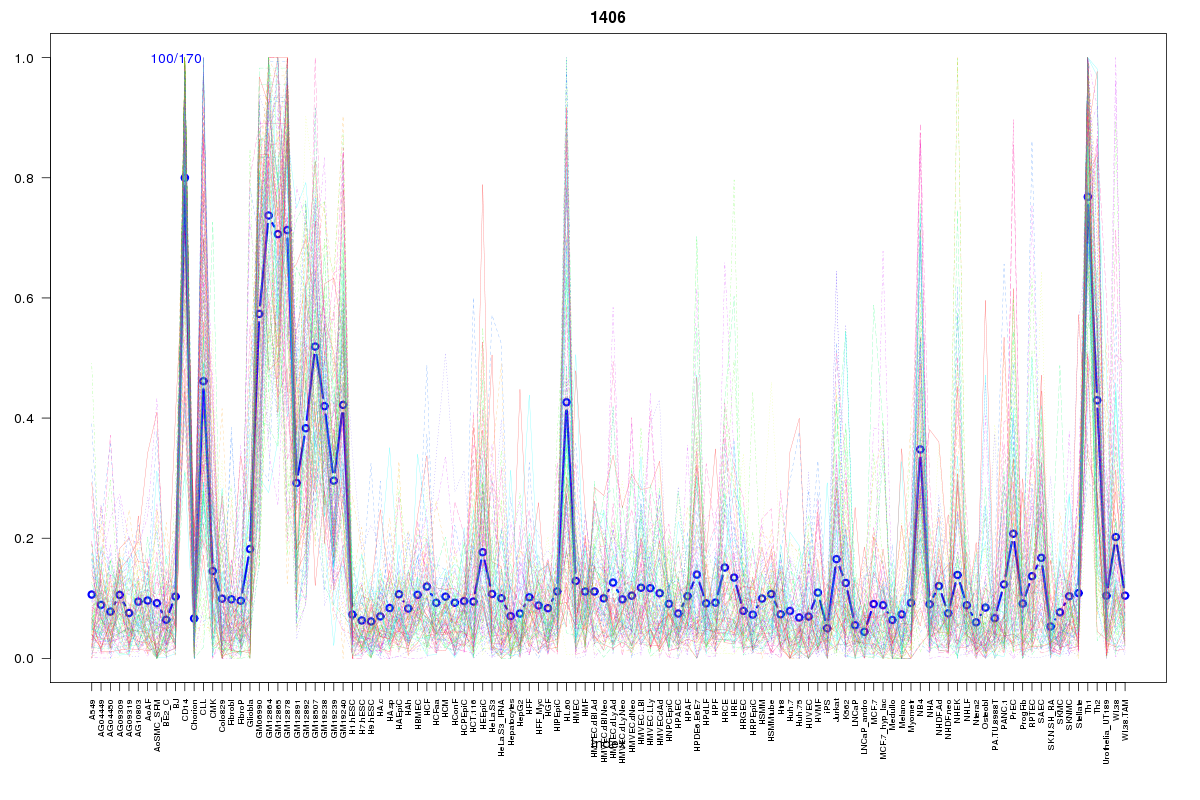 | 1406 | 1 |
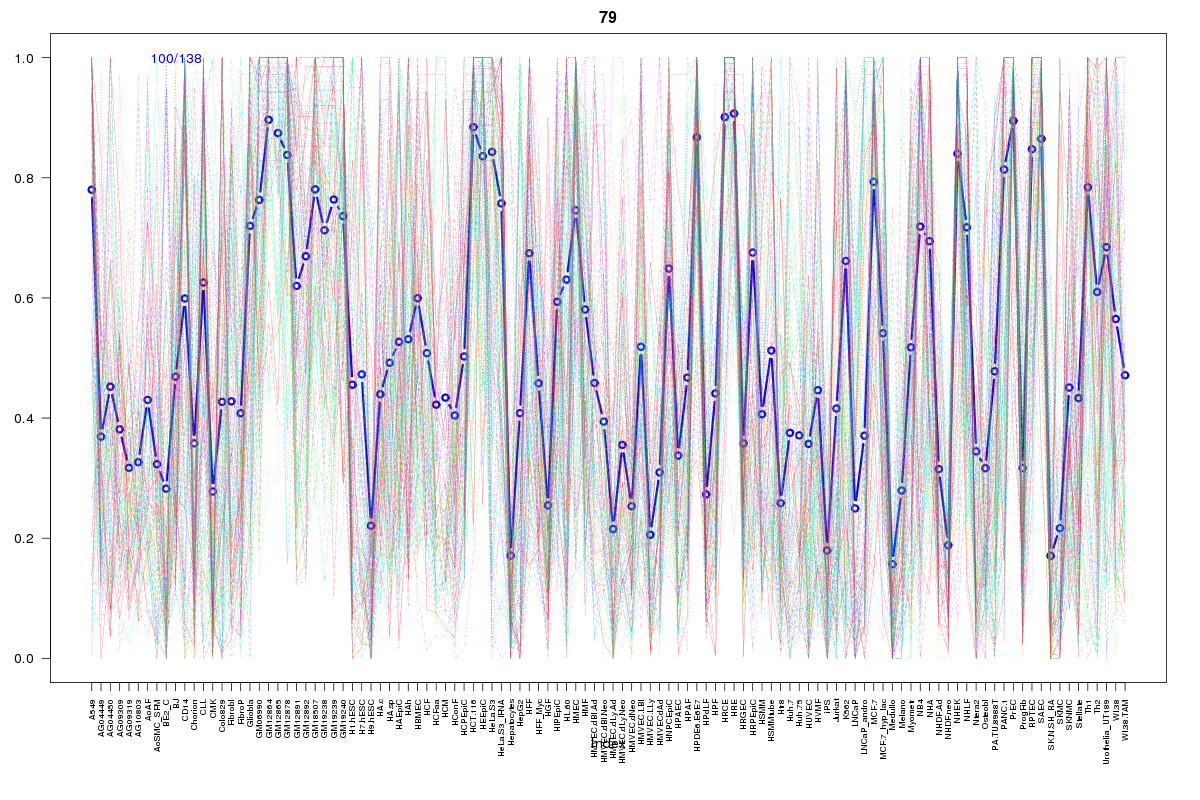 | 79 | 1 |
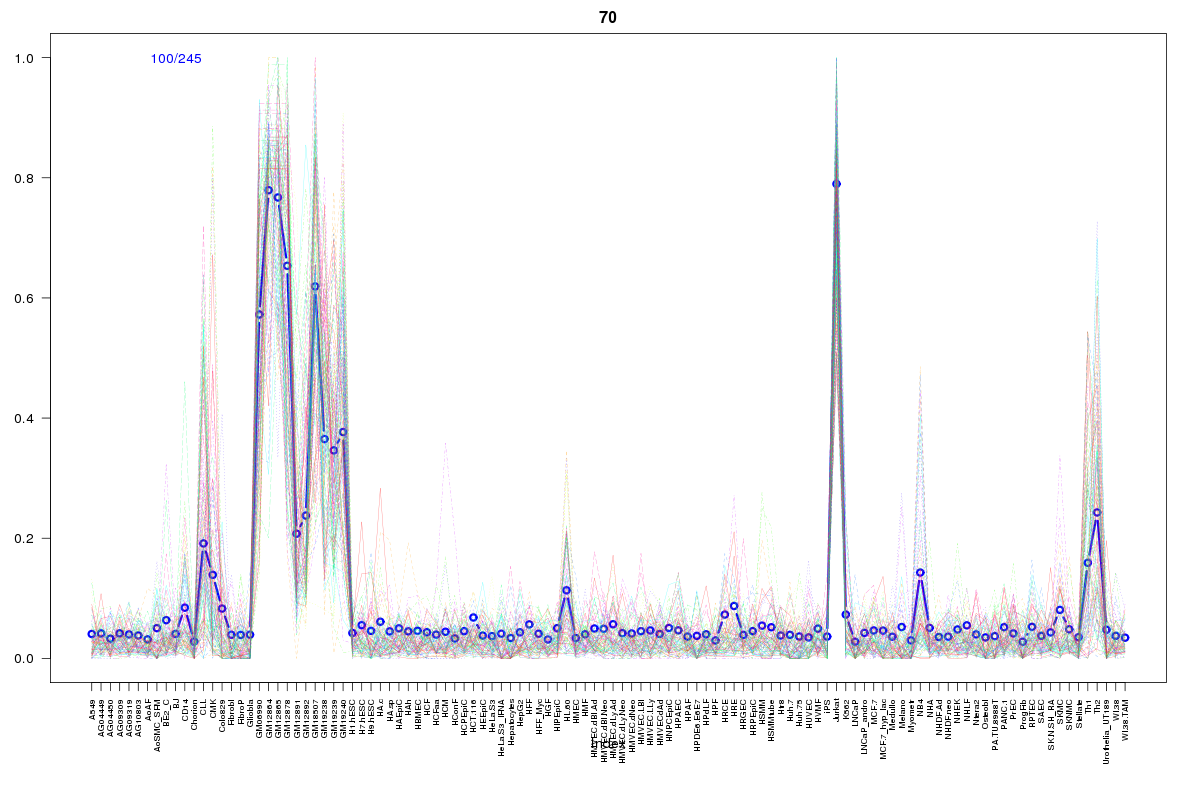 | 70 | 1 |
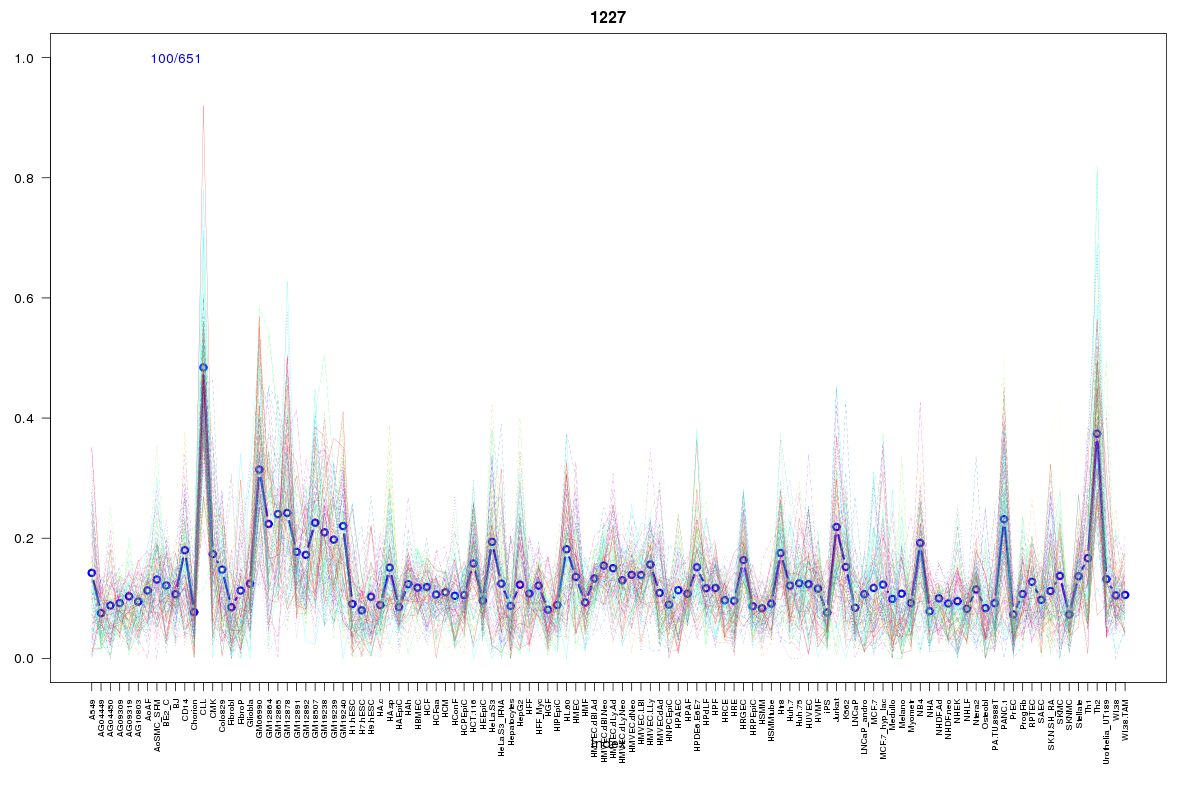 | 1227 | 1 |
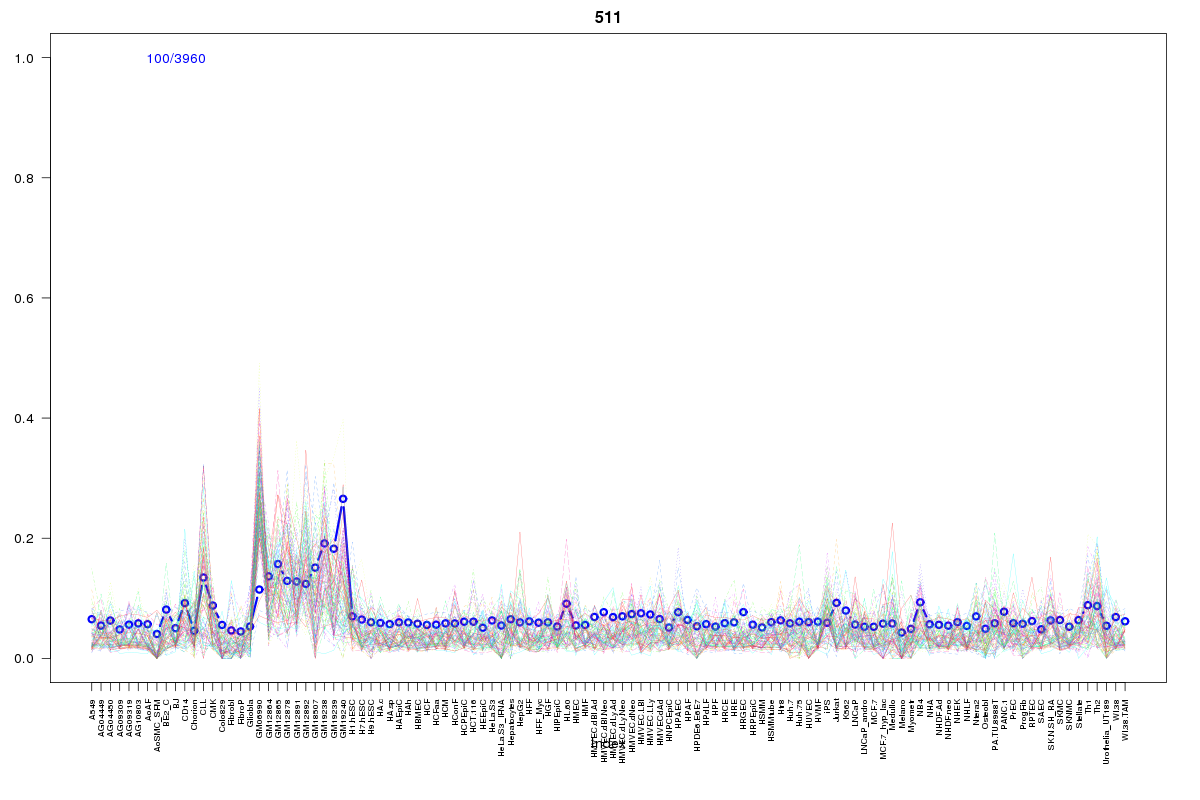 | 511 | 1 |
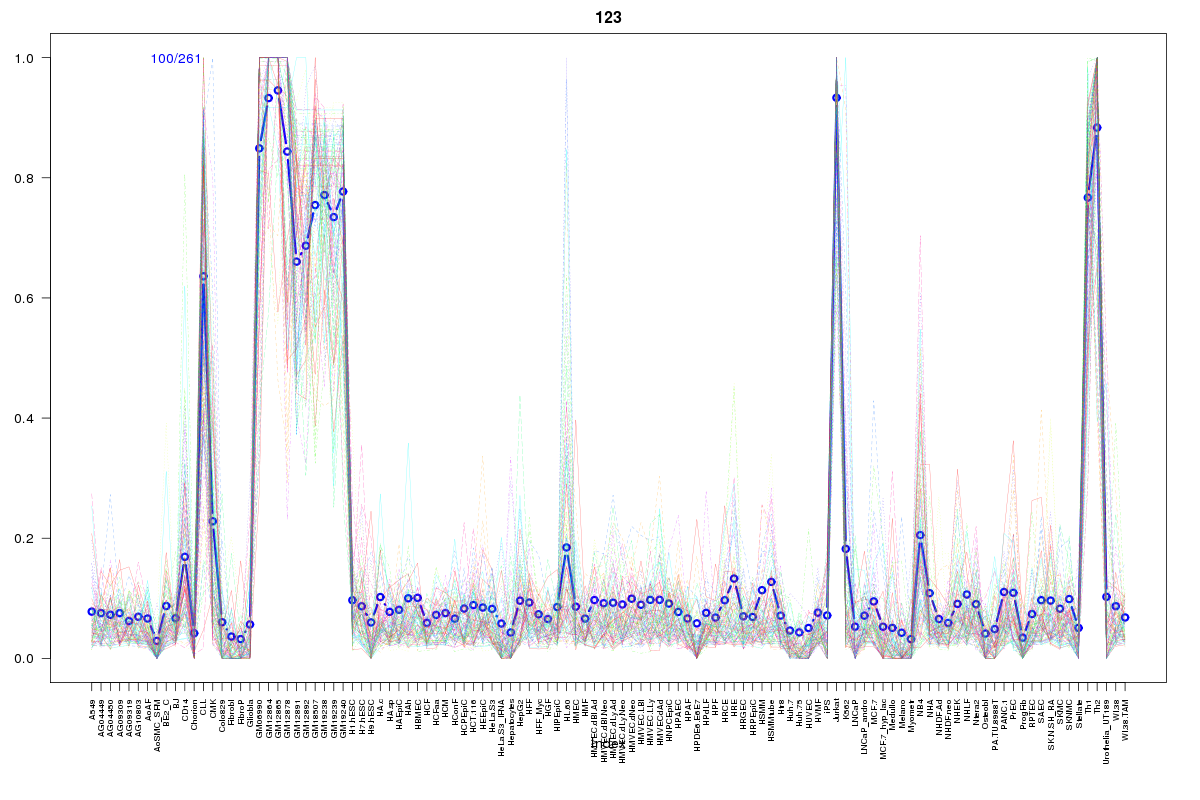 | 123 | 1 |
Resources
BED file downloads
Connects to 55 DHS sitesTop 10 Correlated DHS Sites
p-values indiciate significant higher or lower correlation| Location | Cluster | P-value |
|---|---|---|
| chr1:28454240-28454390 | 274 | 0 |
| chr1:28503140-28503290 | 275 | 0 |
| chr1:28437740-28437890 | 426 | 0 |
| chr1:28502020-28502170 | 217 | 0.001 |
| chr1:28471460-28471610 | 217 | 0.001 |
| chr1:28462180-28462330 | 2269 | 0.001 |
| chr1:28497840-28497990 | 215 | 0.002 |
| chr1:28454560-28454710 | 217 | 0.003 |
| chr1:28499280-28499430 | 76 | 0.003 |
| chr1:28471100-28471250 | 79 | 0.005 |
| chr1:28474500-28474650 | 217 | 0.005 |
External Databases
UCSCEnsembl (ENSG00000169403)