Gene: ATP13A3
chr3: 194123400-194219093Expression Profile
(log scale)
Graphical Connections
Distribution of linked clusters:
You may find it interesting if many of the connected DHS sites belong to the same cluster.| Cluster Profile | Cluster ID | Number of DHS sites in this cluster |
|---|---|---|
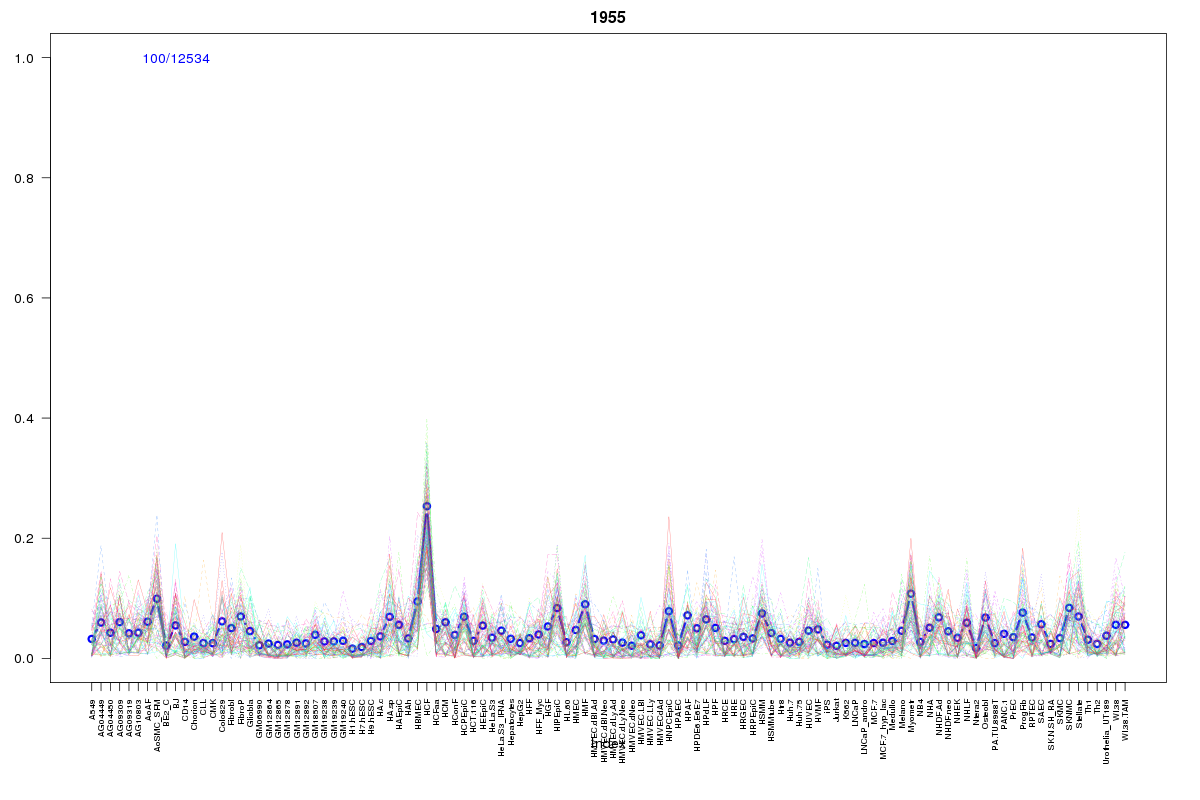 | 1955 | 4 |
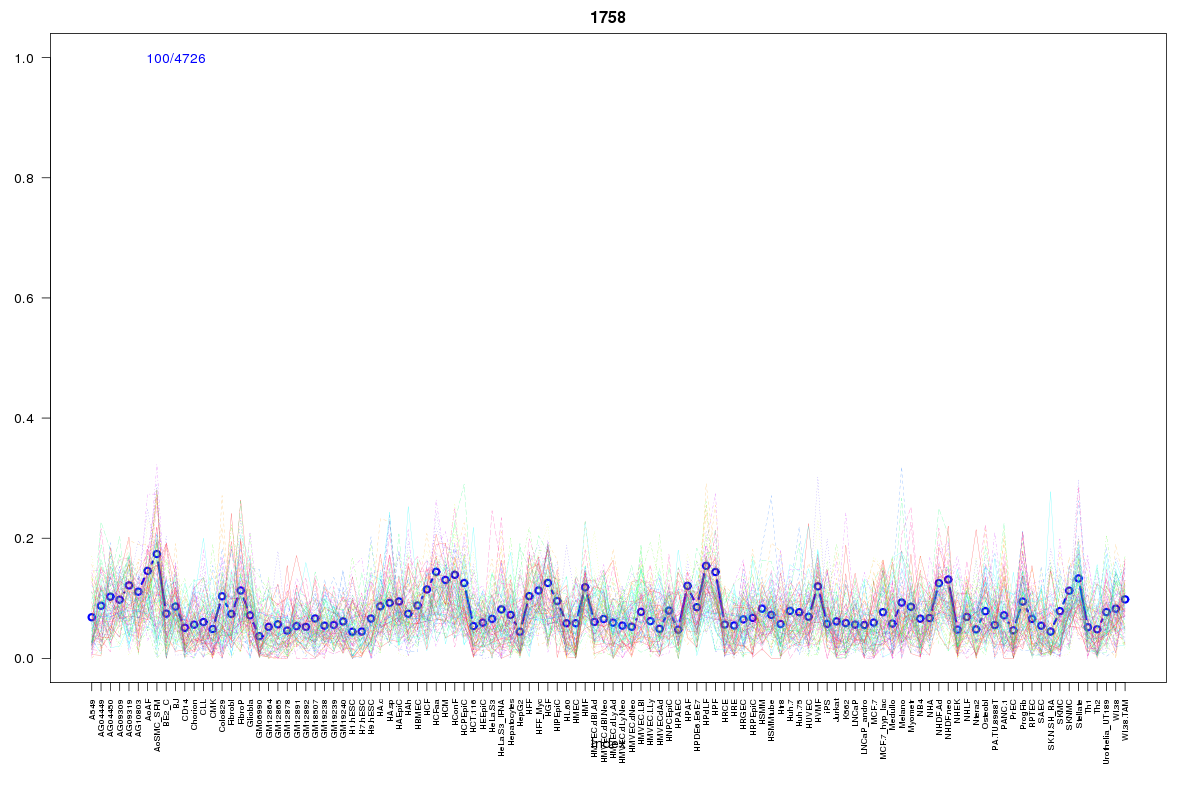 | 1758 | 3 |
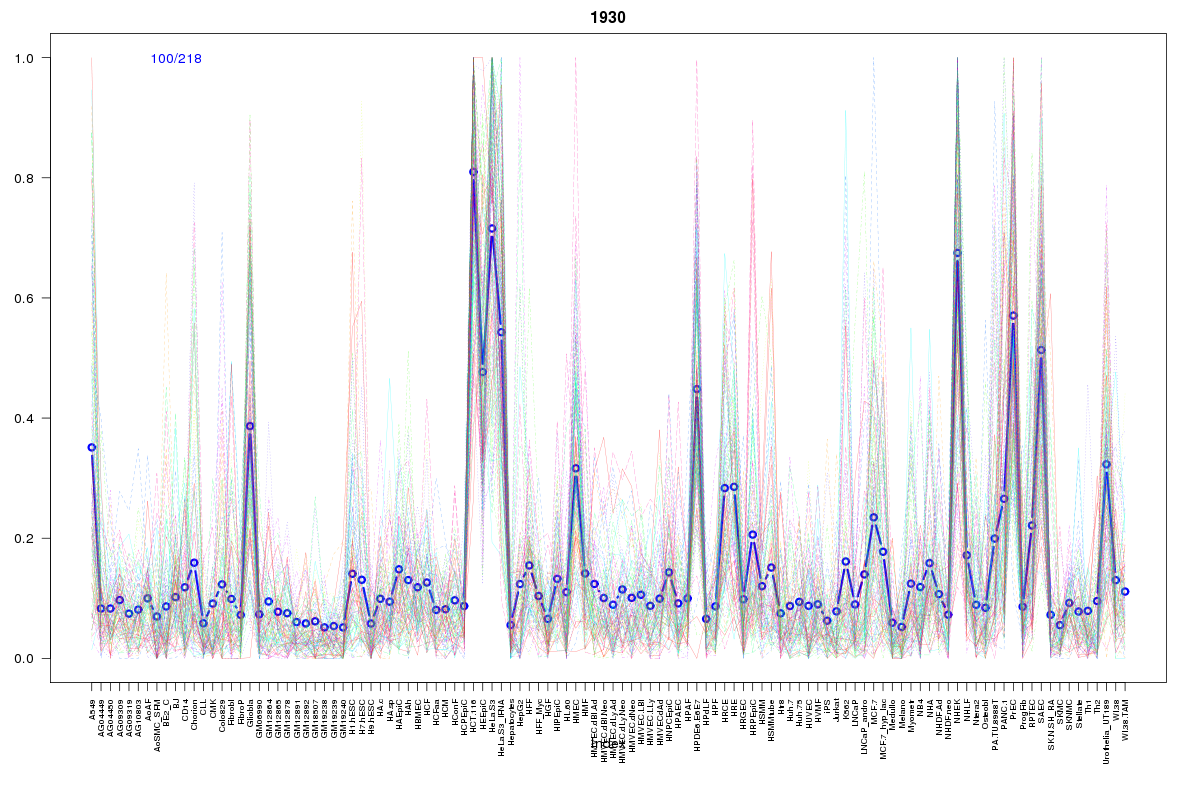 | 1930 | 2 |
 | 1942 | 2 |
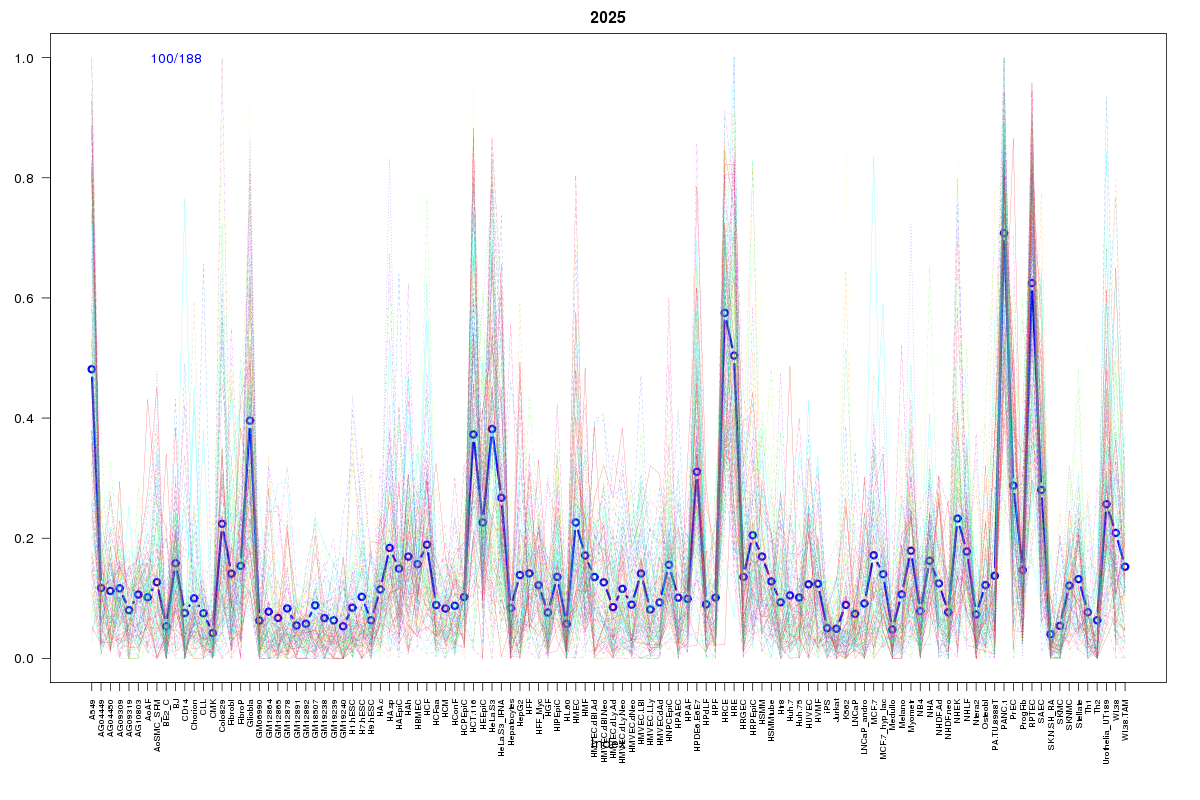 | 2025 | 2 |
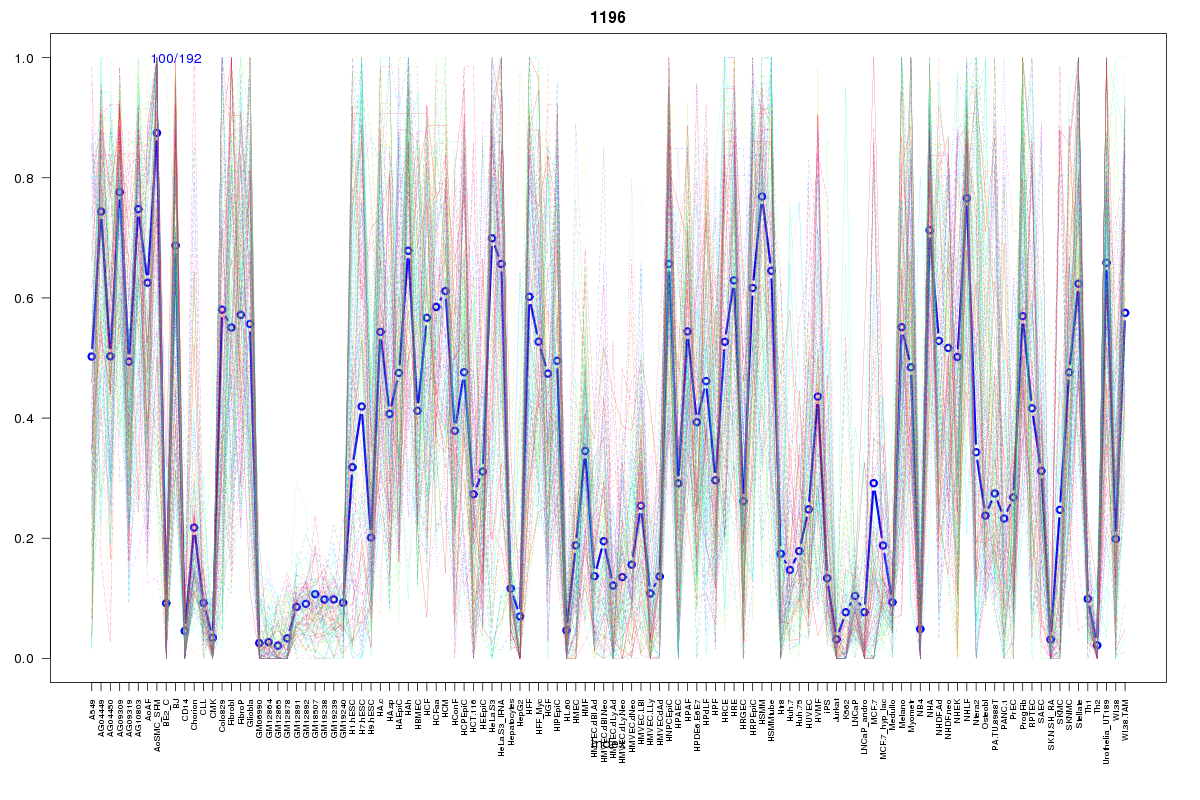 | 1196 | 2 |
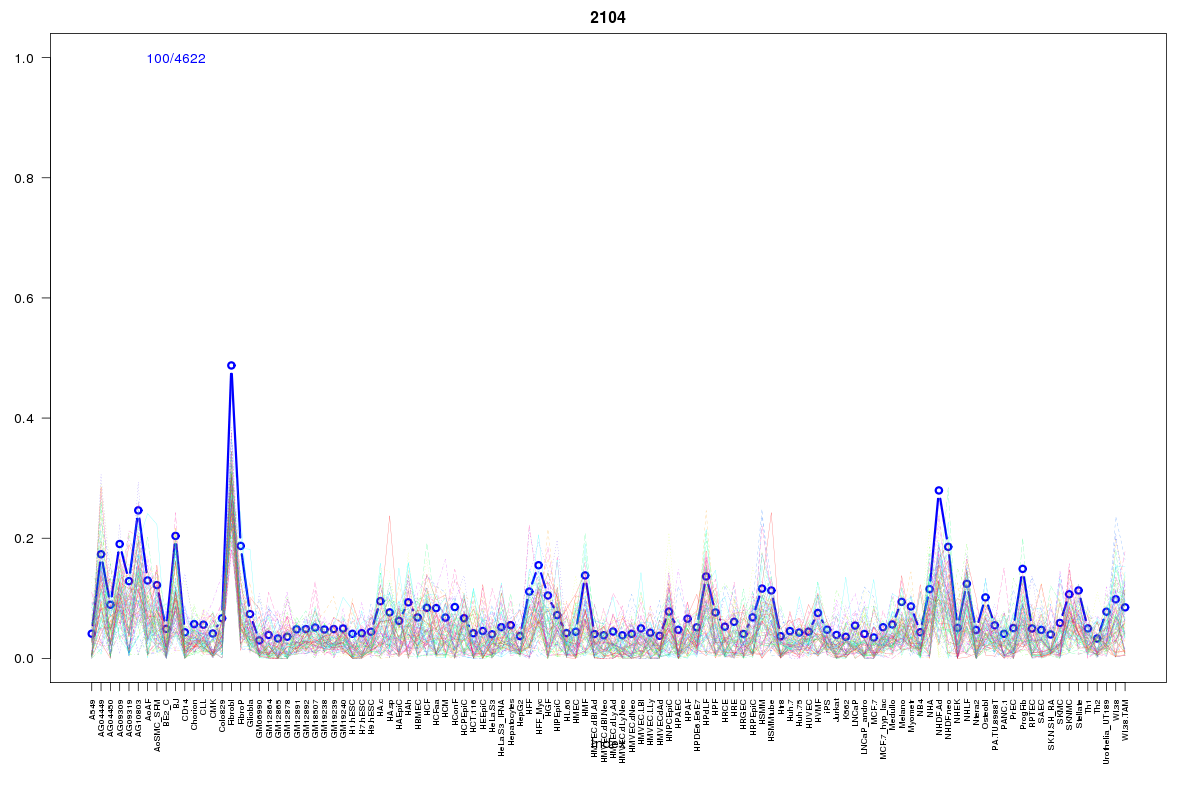 | 2104 | 2 |
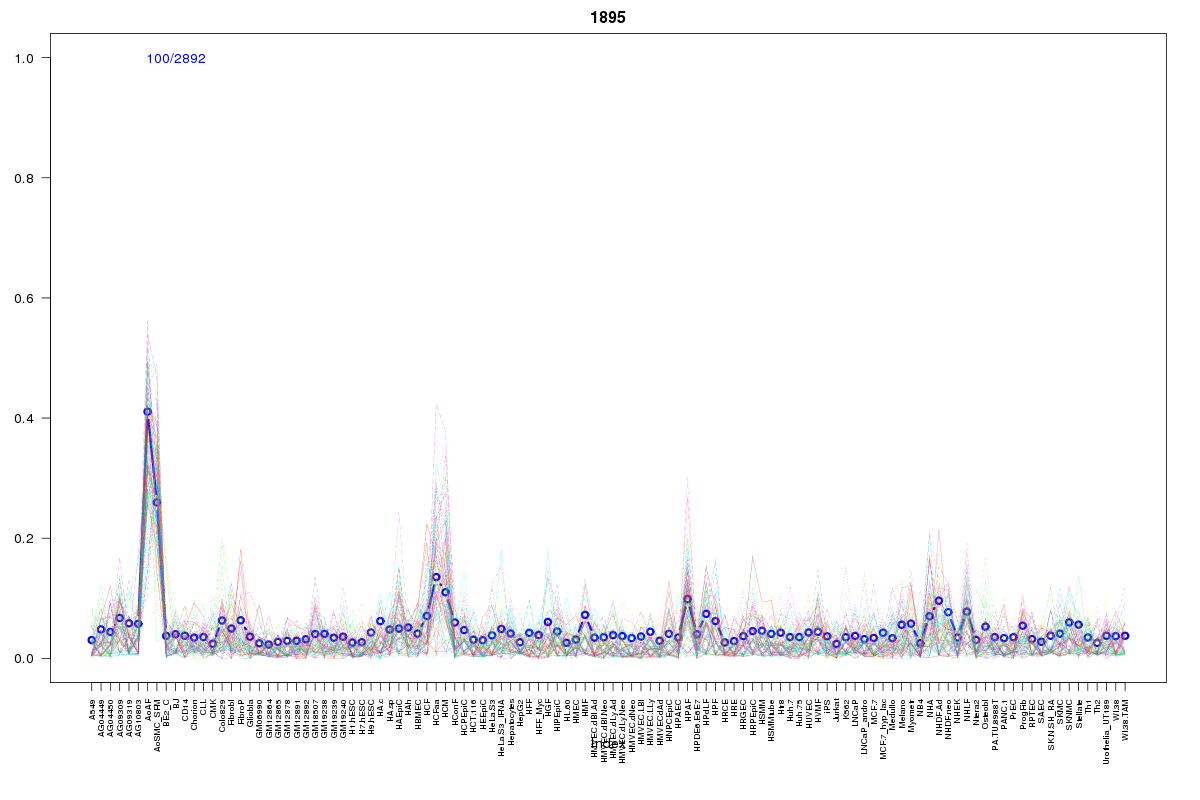 | 1895 | 2 |
 | 934 | 1 |
 | 18 | 1 |
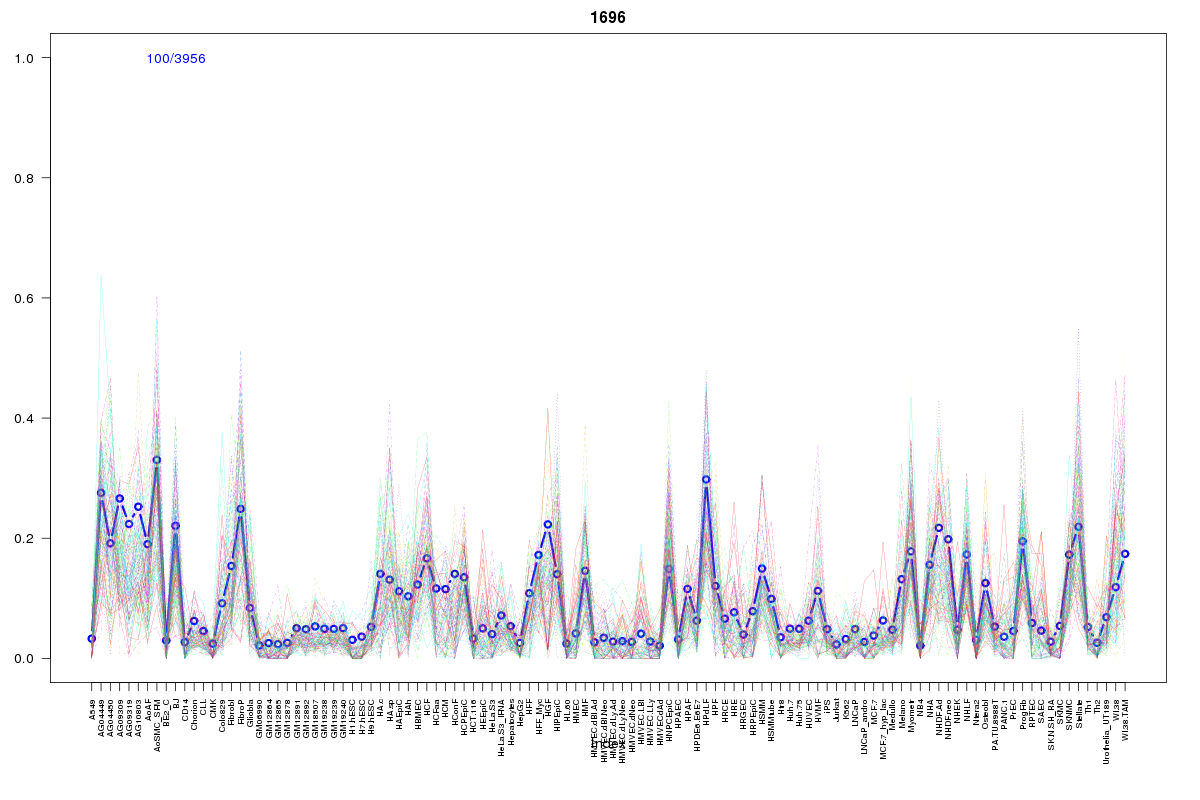 | 1696 | 1 |
 | 2223 | 1 |
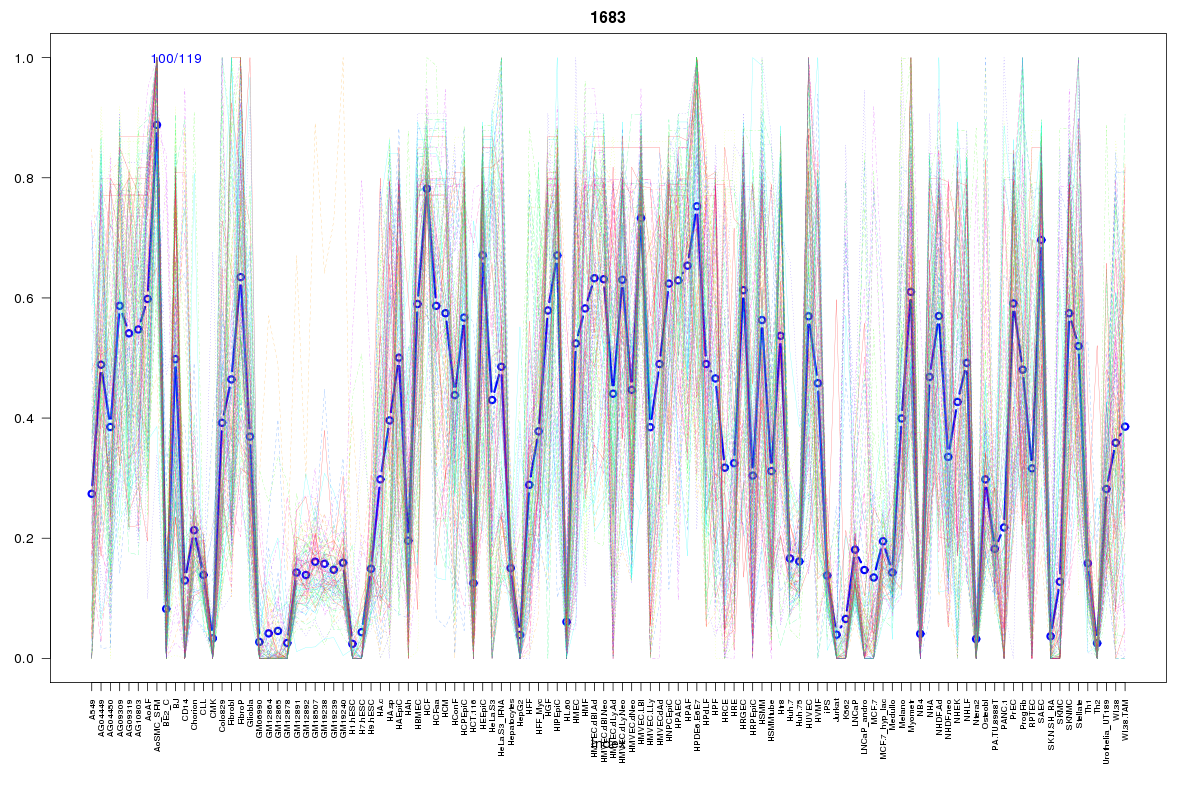 | 1683 | 1 |
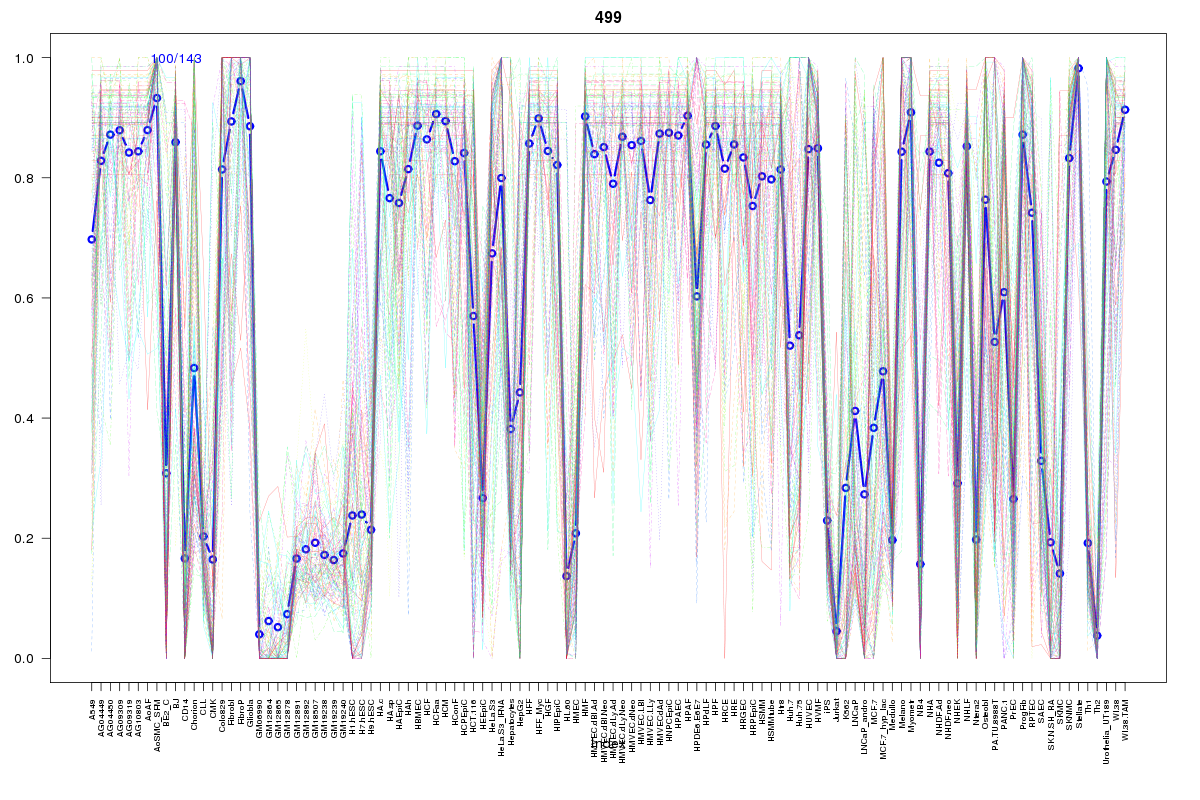 | 499 | 1 |
 | 77 | 1 |
 | 2283 | 1 |
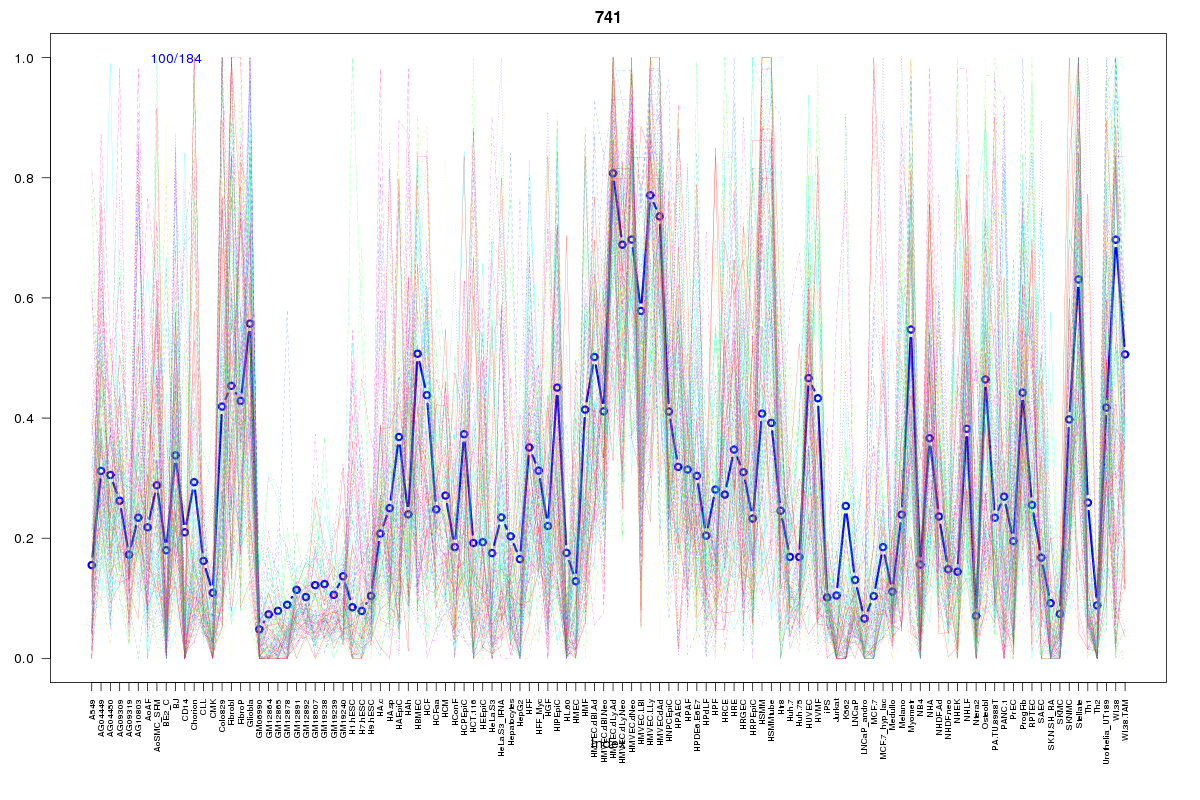 | 741 | 1 |
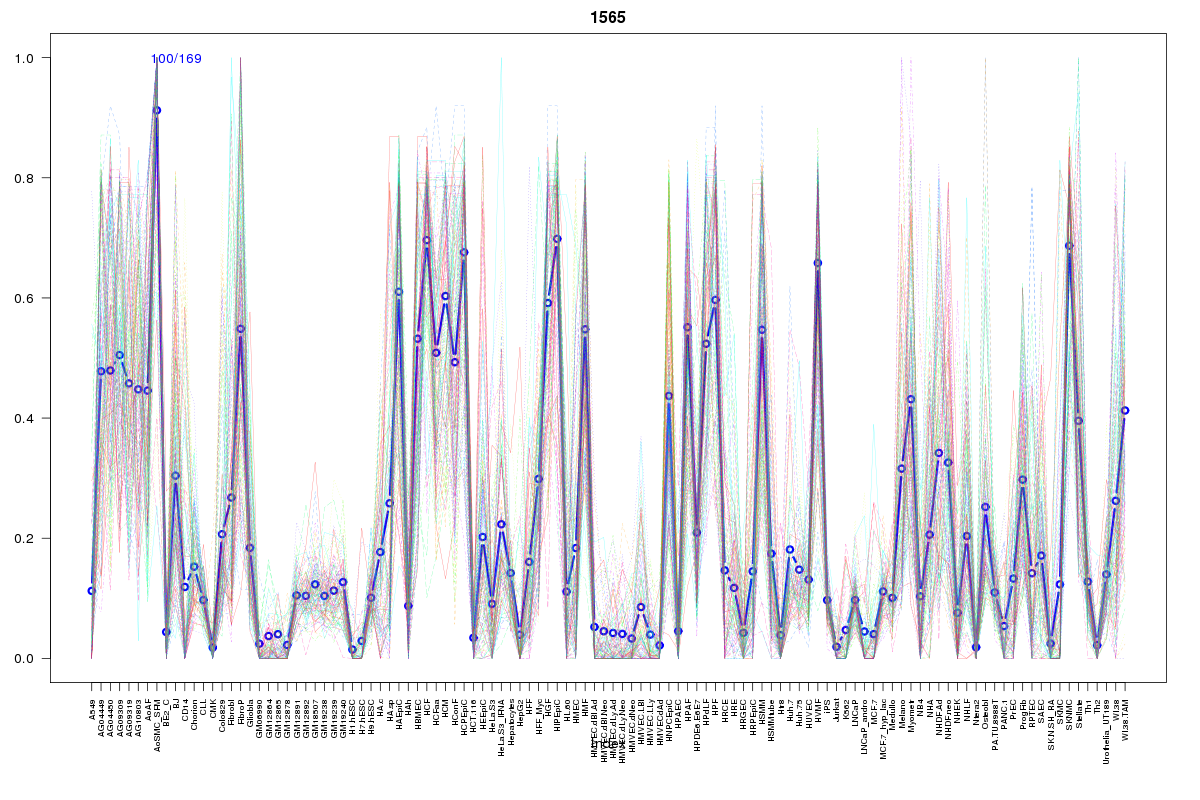 | 1565 | 1 |
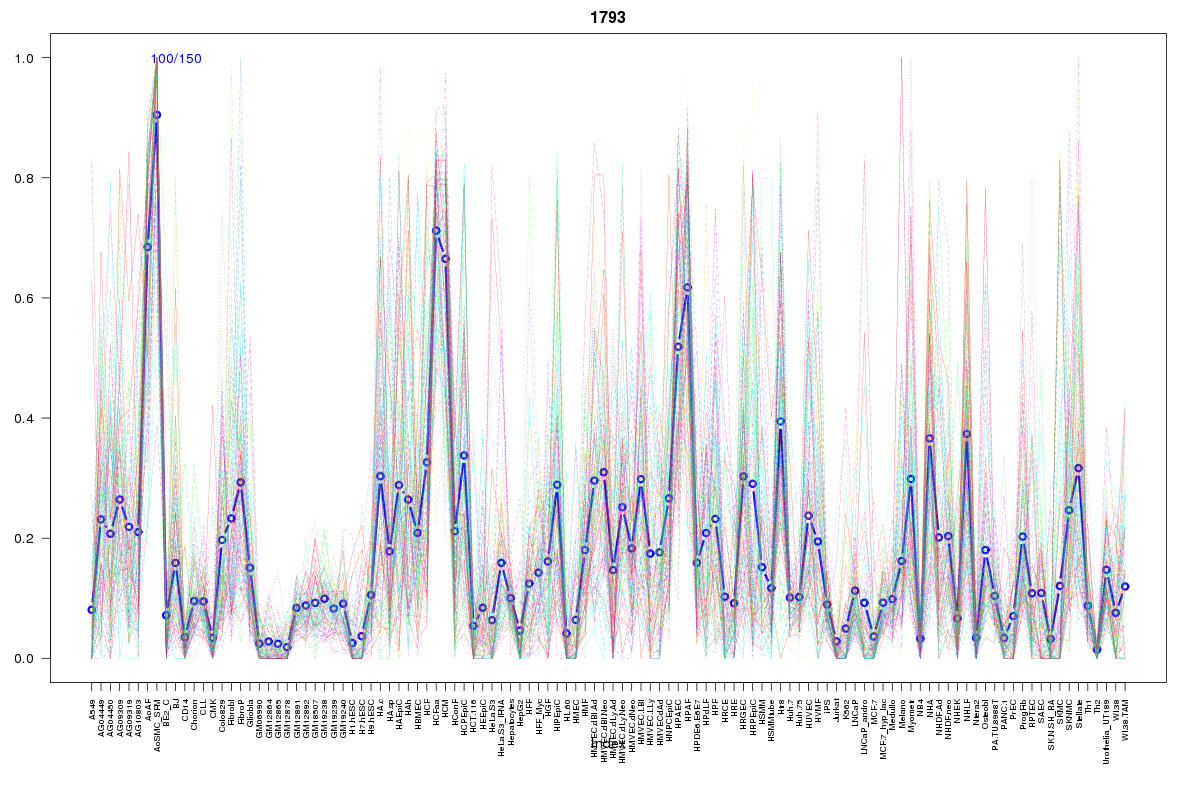 | 1793 | 1 |
 | 2061 | 1 |
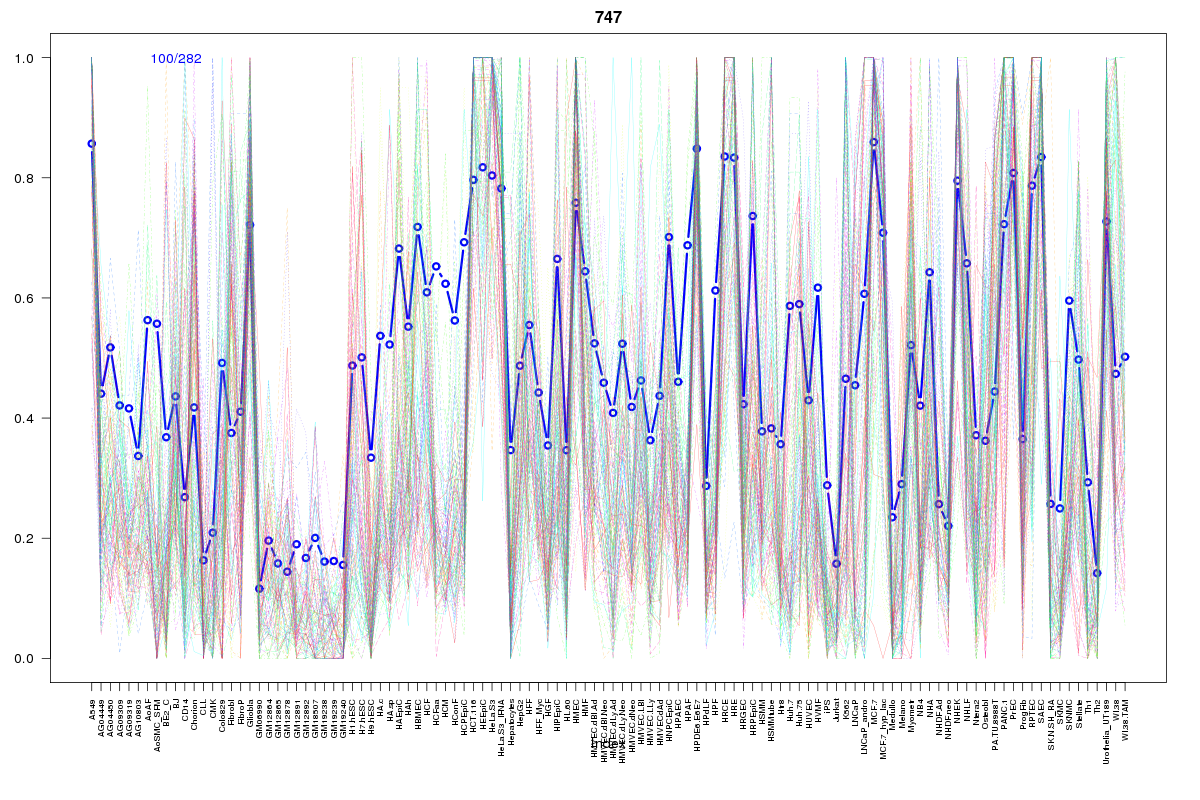 | 747 | 1 |
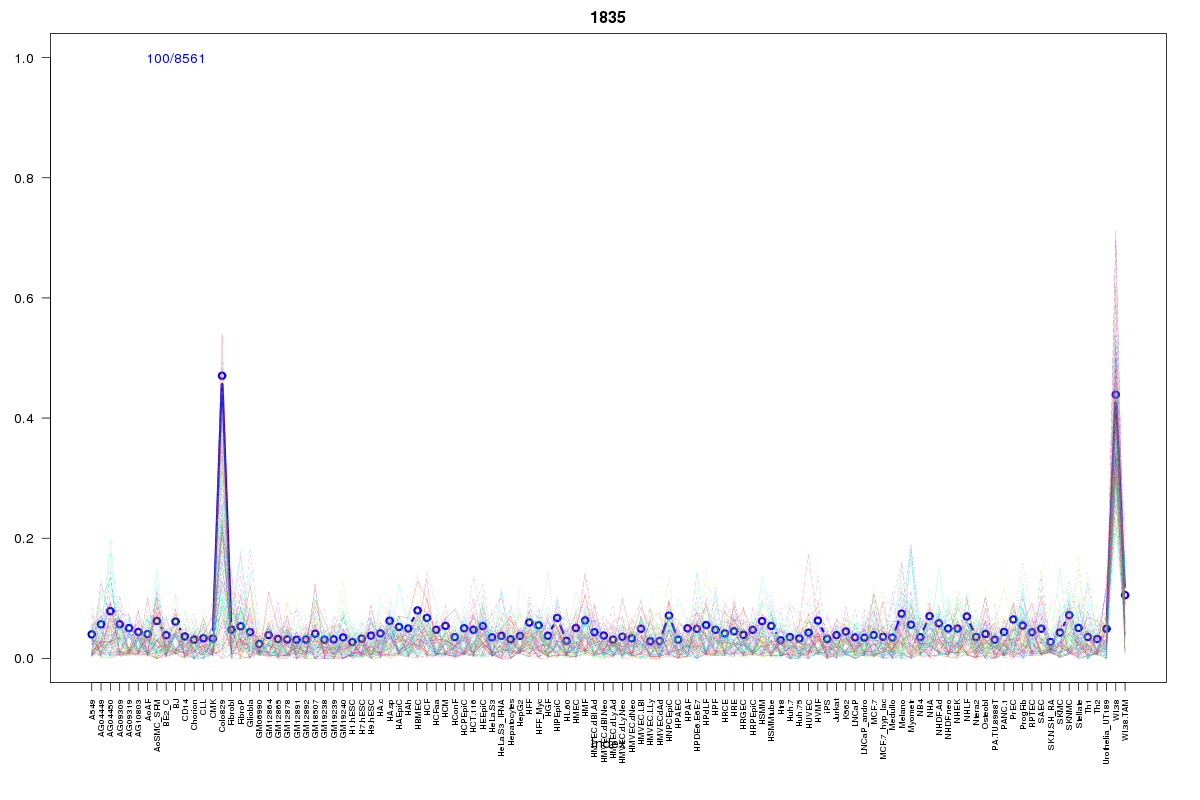 | 1835 | 1 |
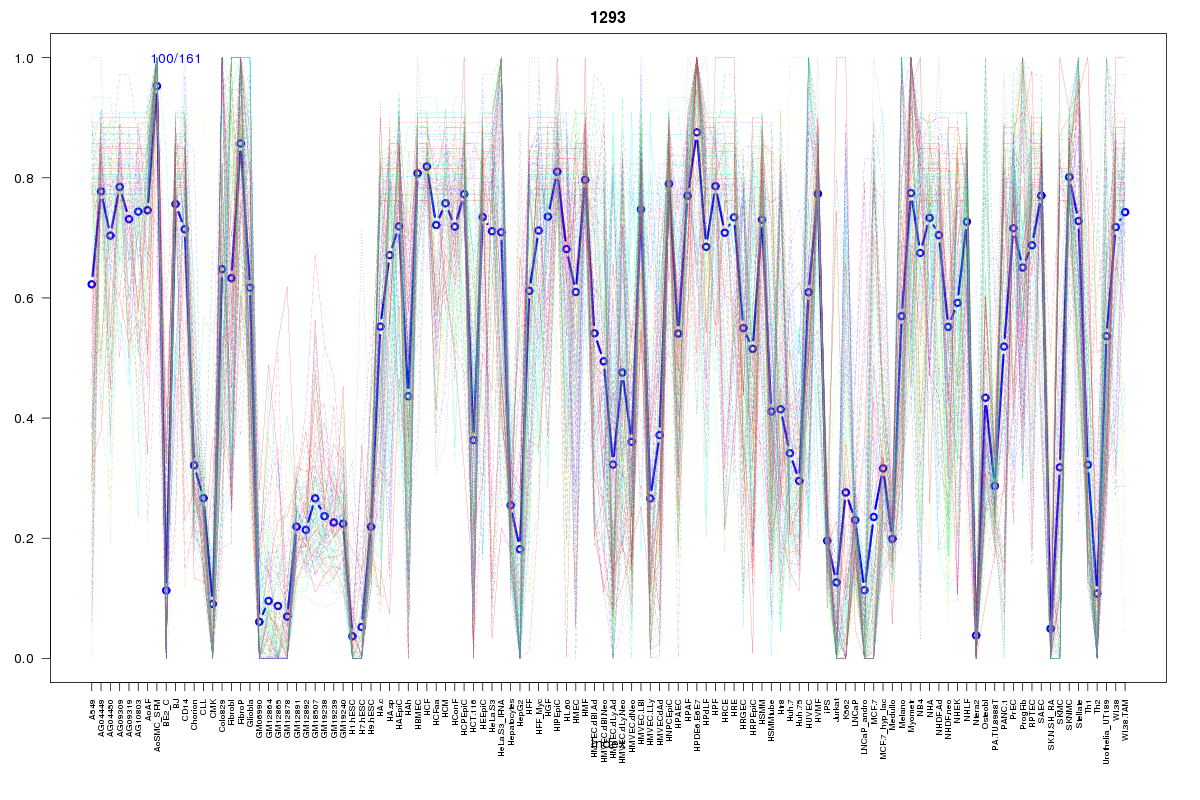 | 1293 | 1 |
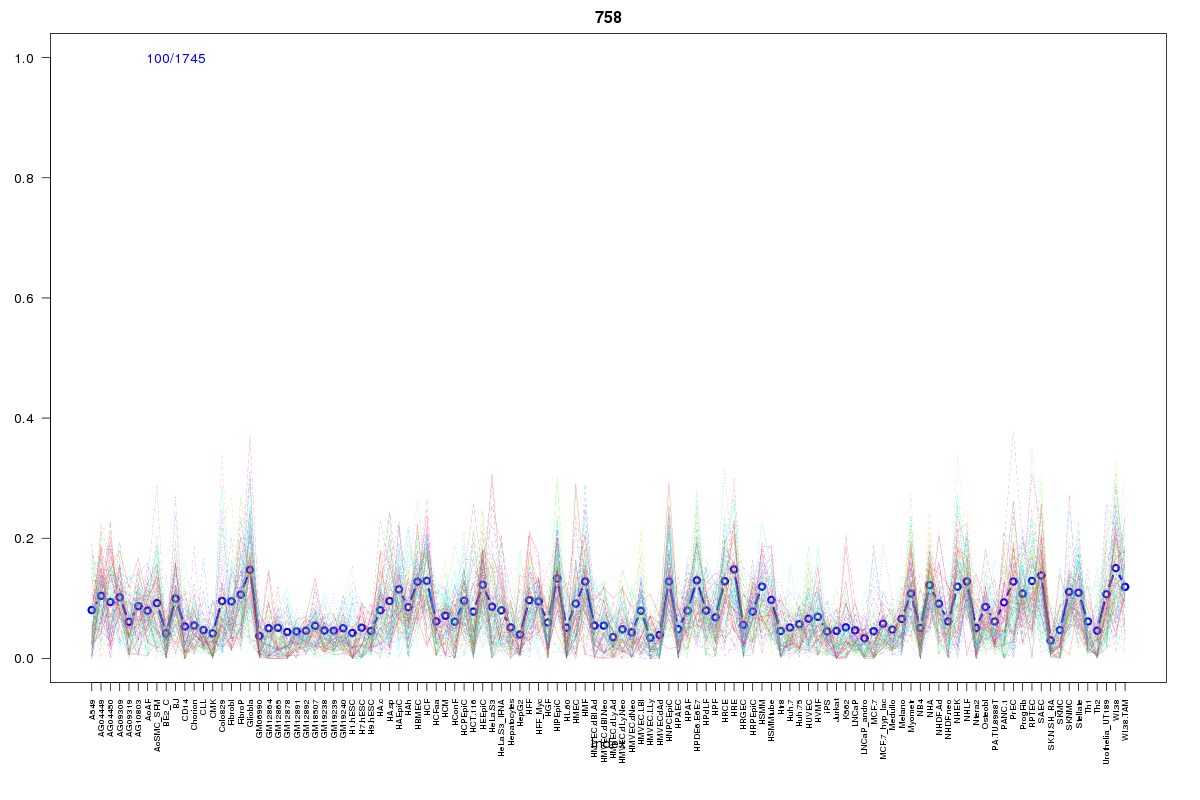 | 758 | 1 |
 | 2394 | 1 |
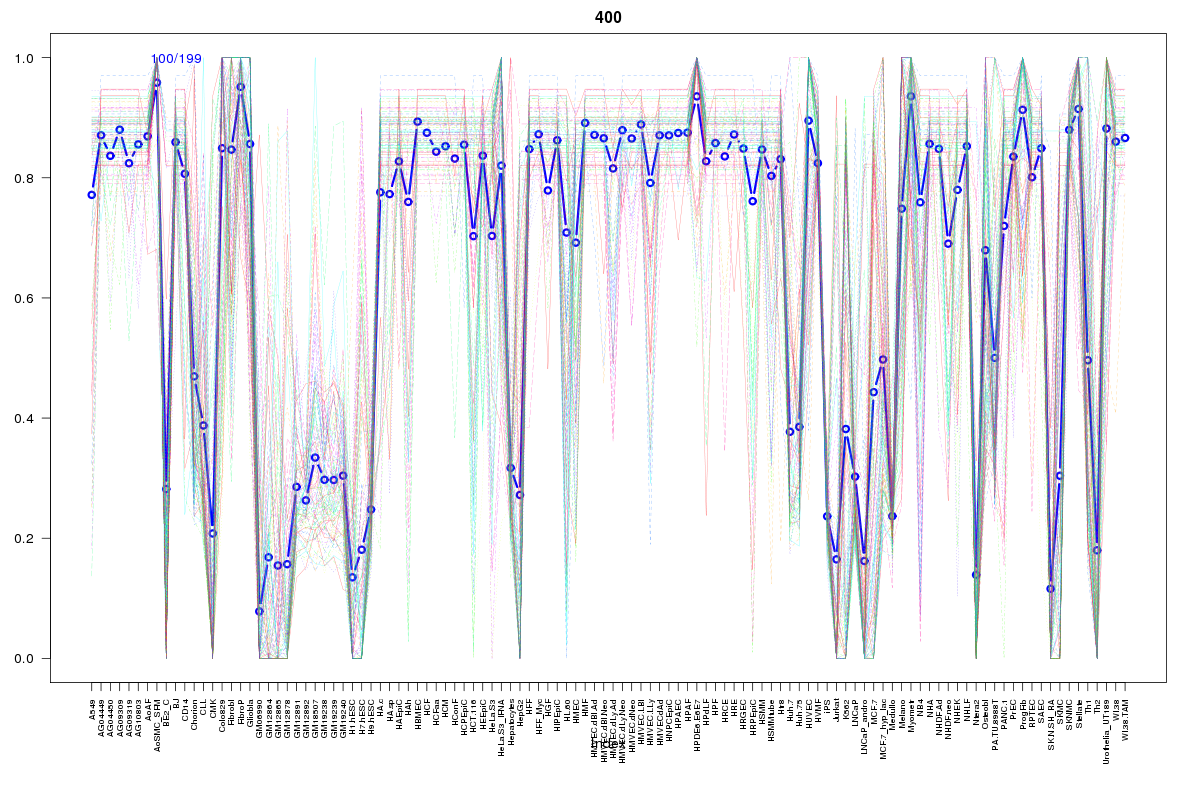 | 400 | 1 |
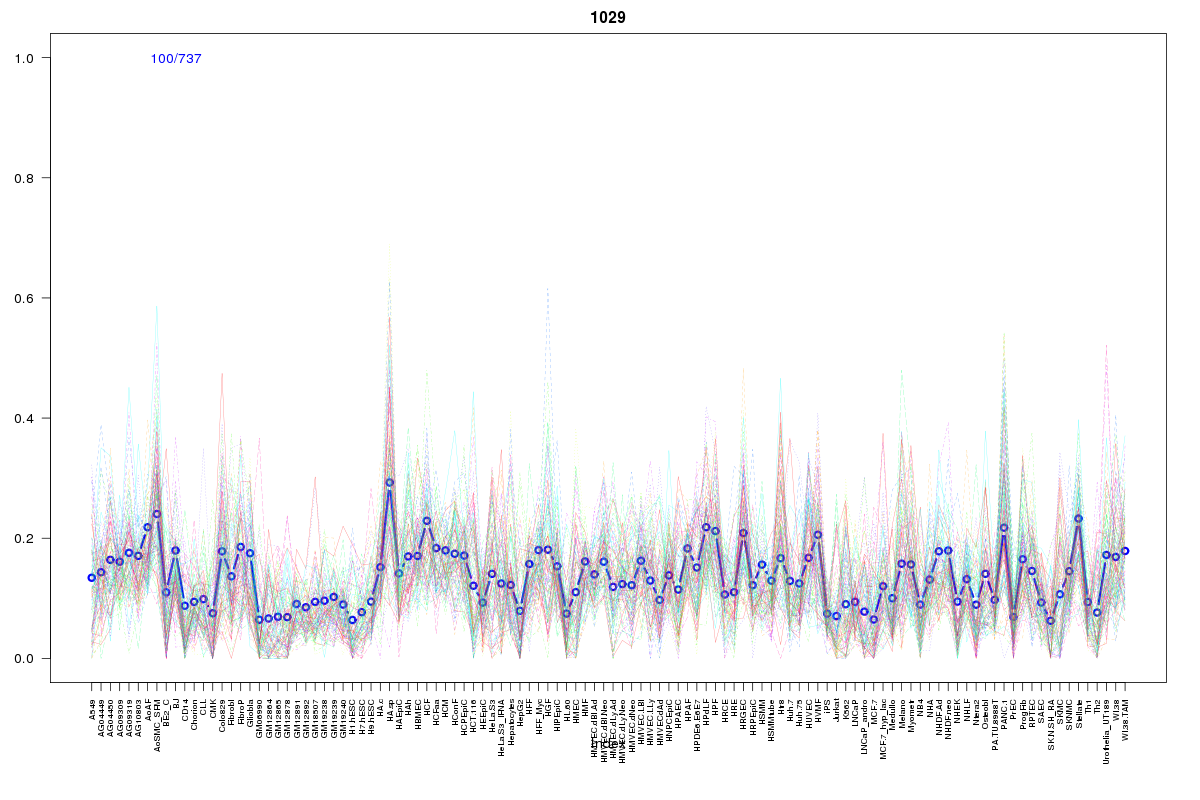 | 1029 | 1 |
 | 568 | 1 |
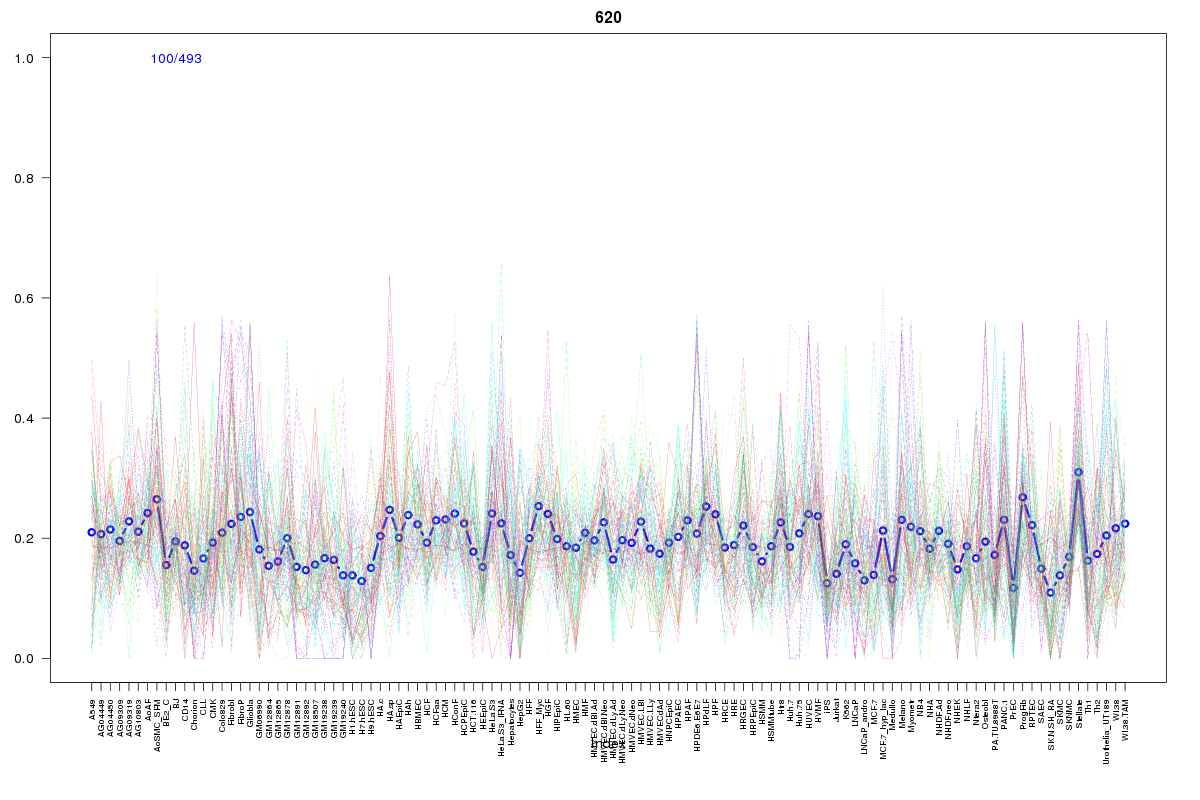 | 620 | 1 |
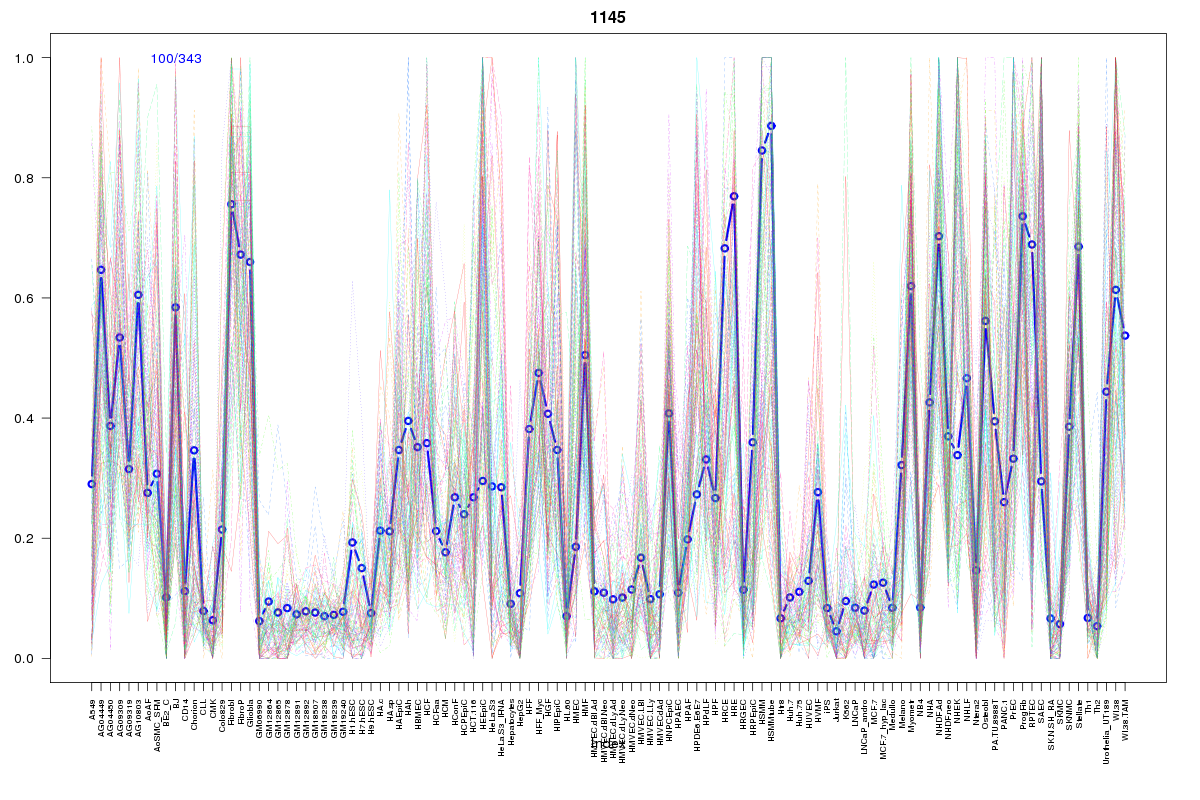 | 1145 | 1 |
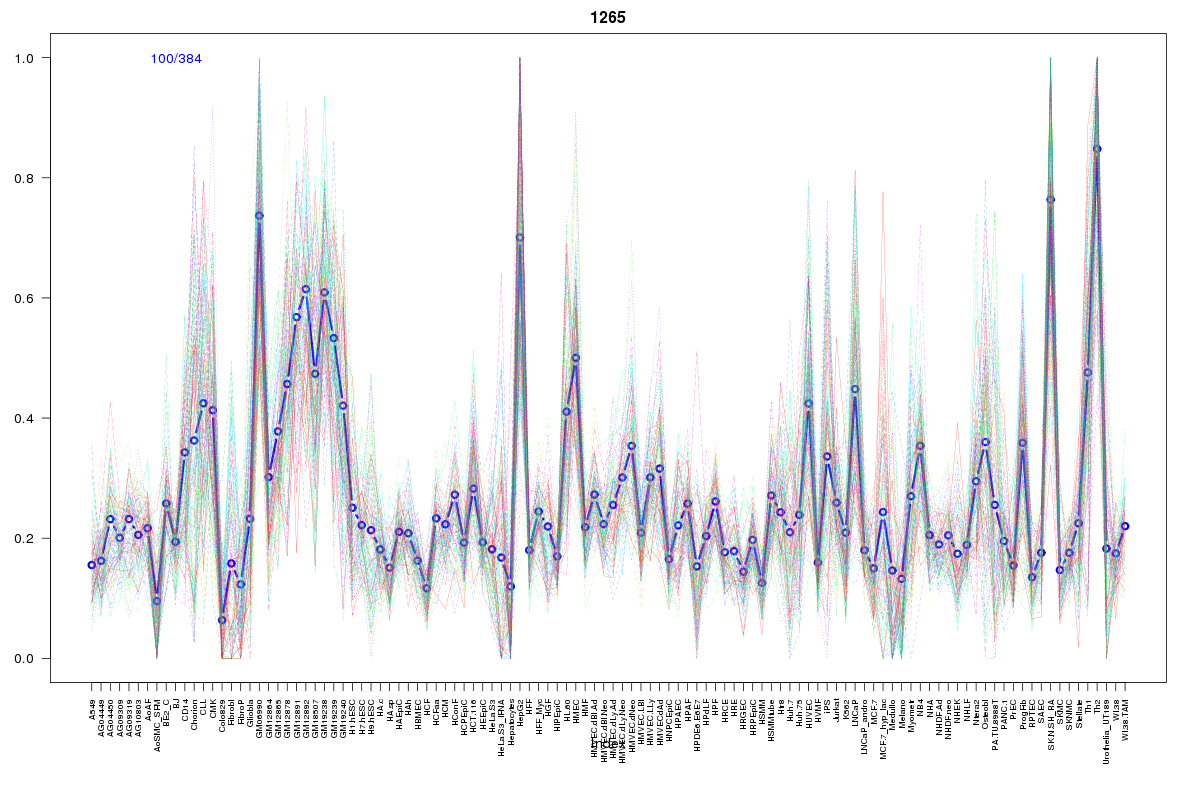 | 1265 | 1 |
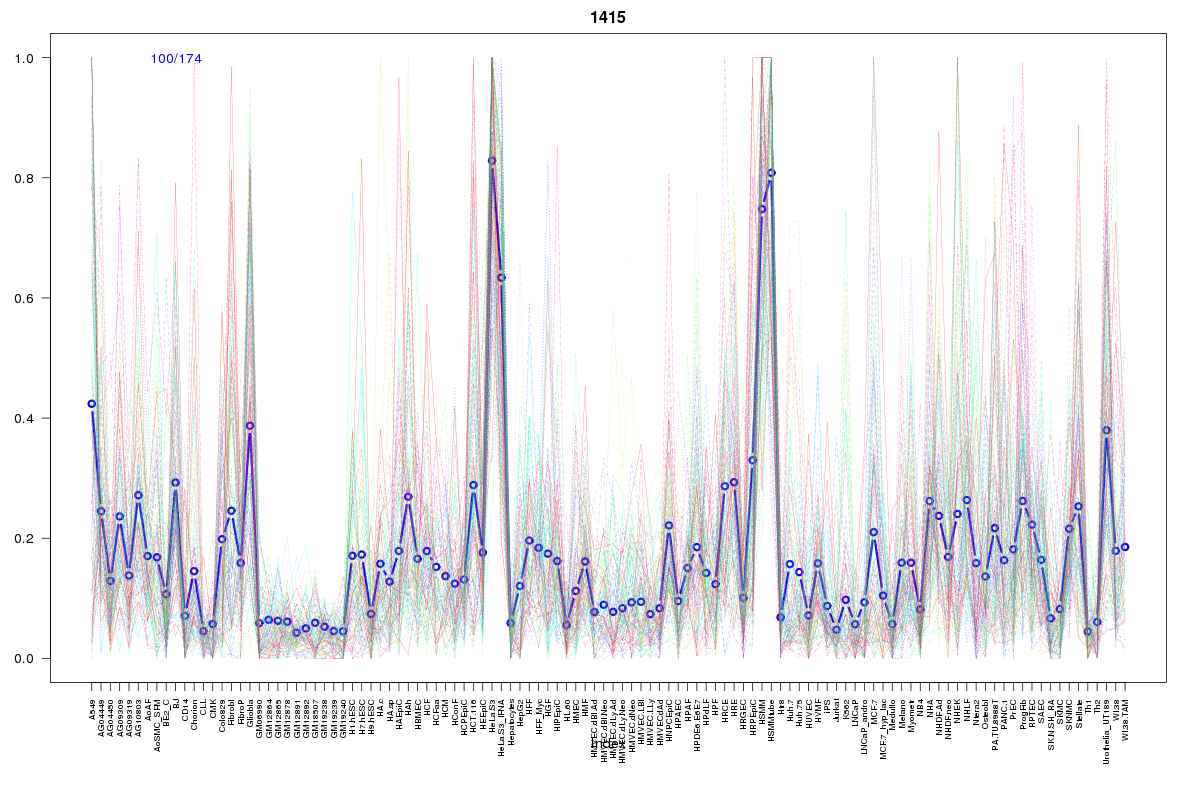 | 1415 | 1 |
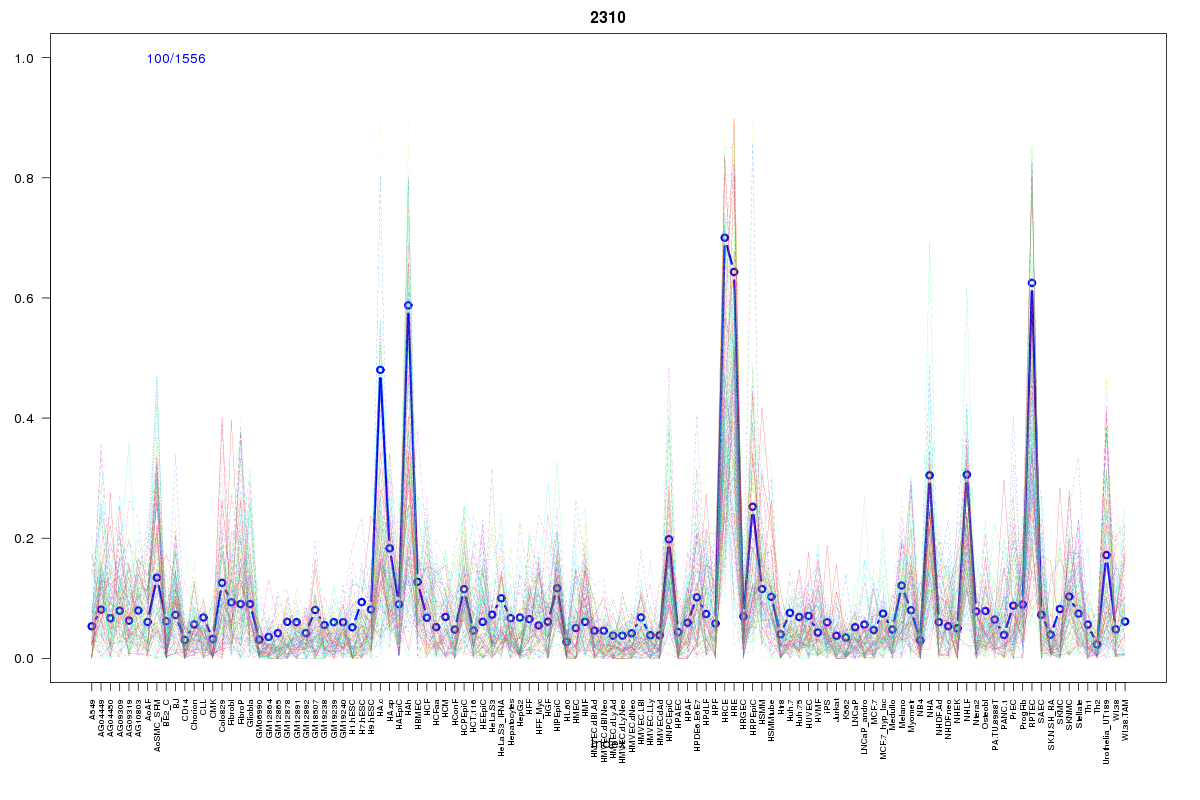 | 2310 | 1 |
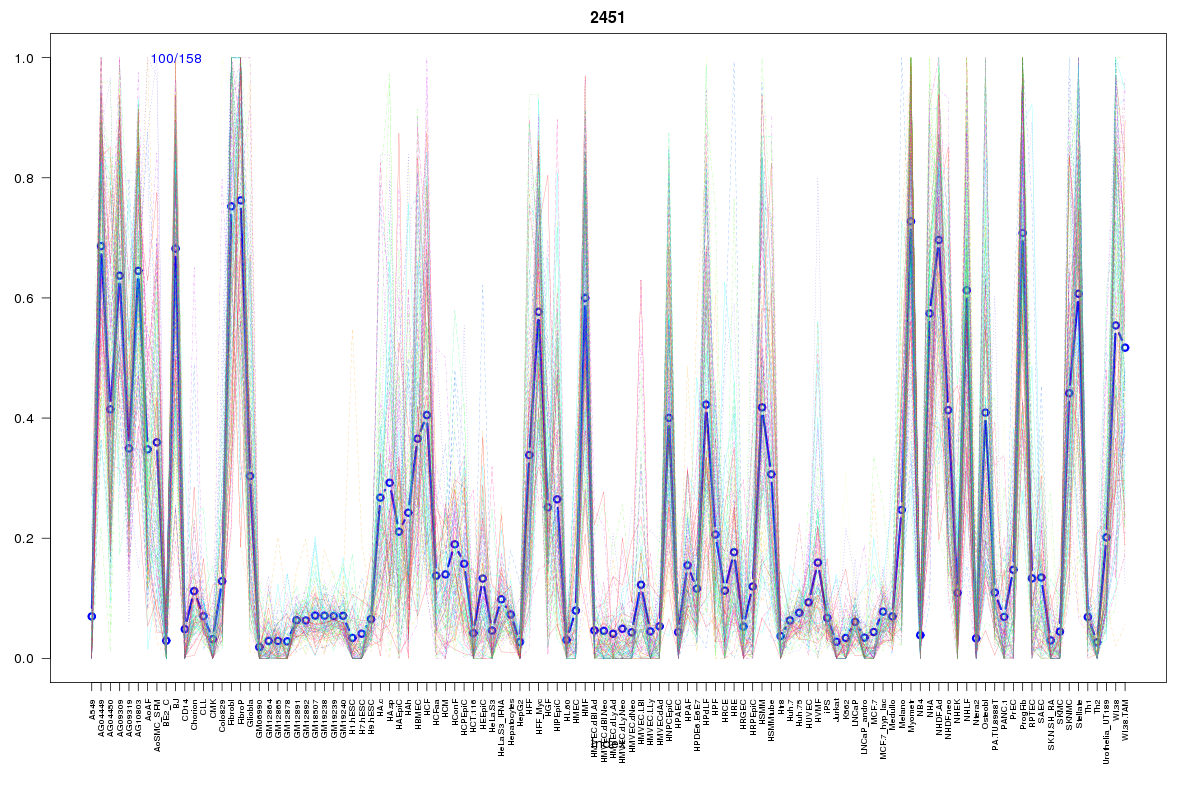 | 2451 | 1 |
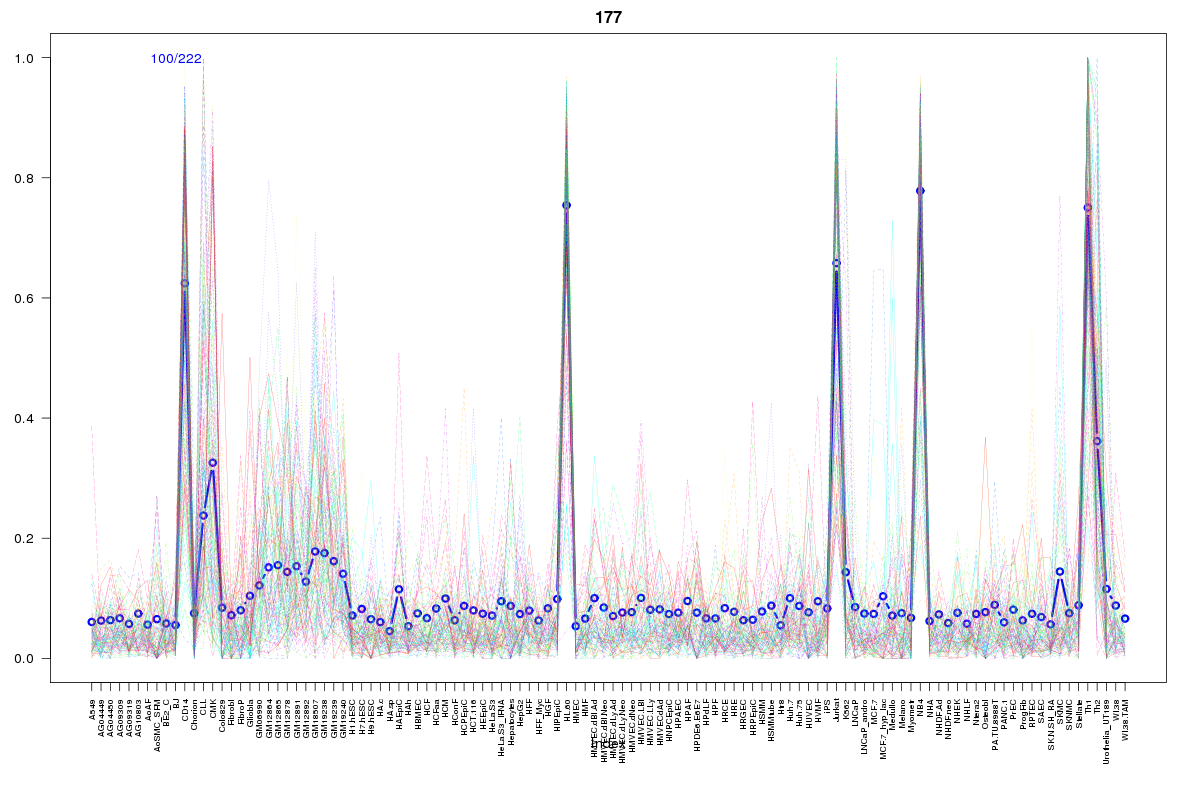 | 177 | 1 |
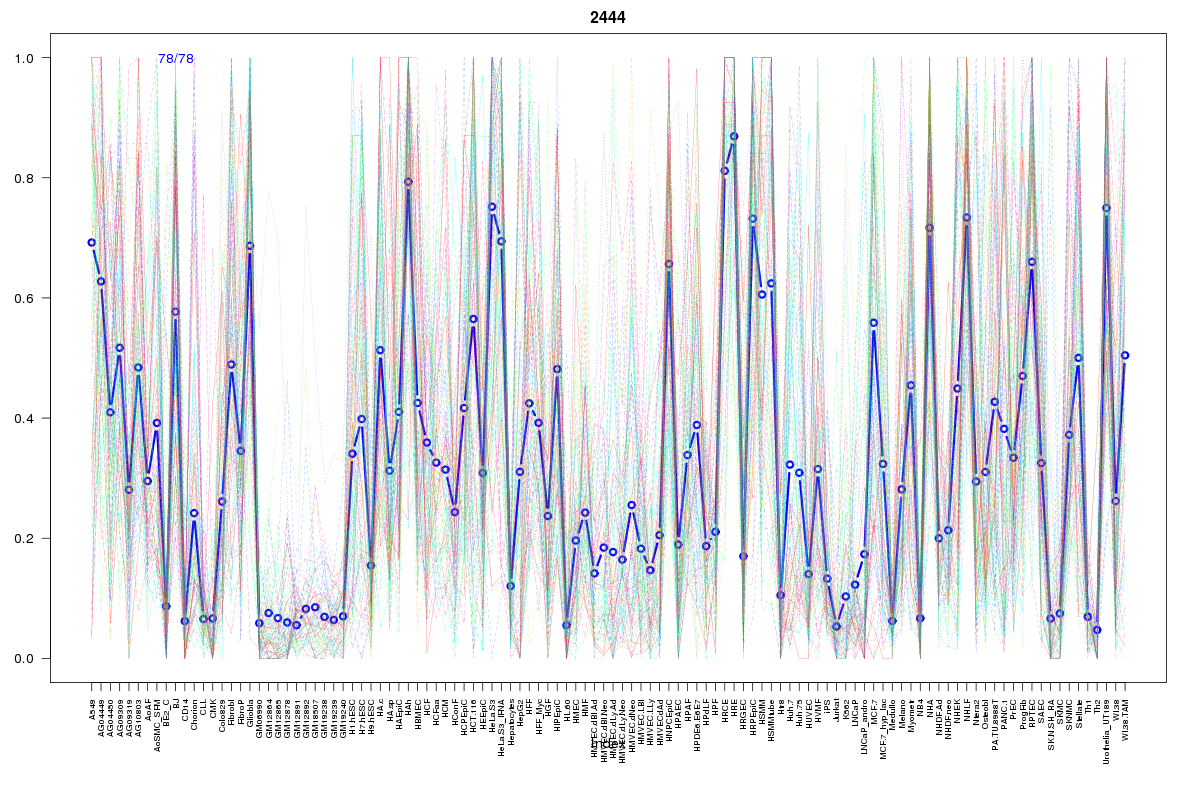 | 2444 | 1 |
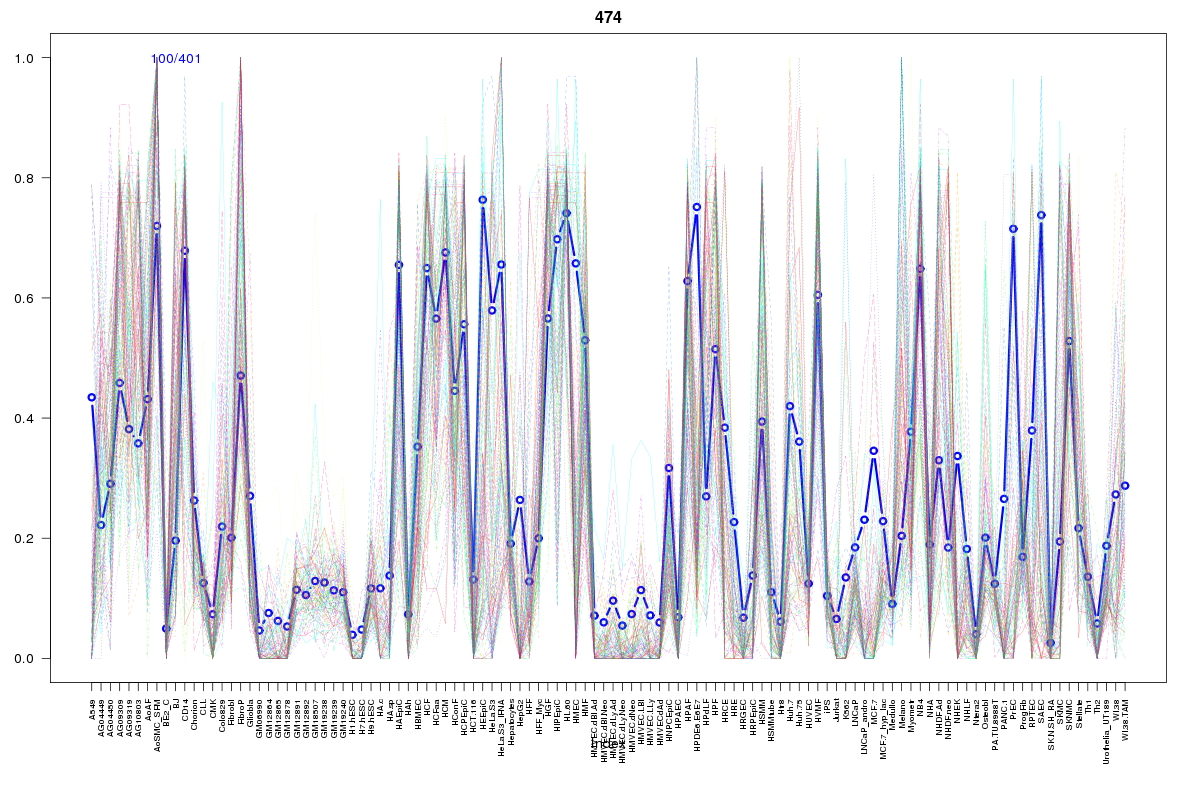 | 474 | 1 |
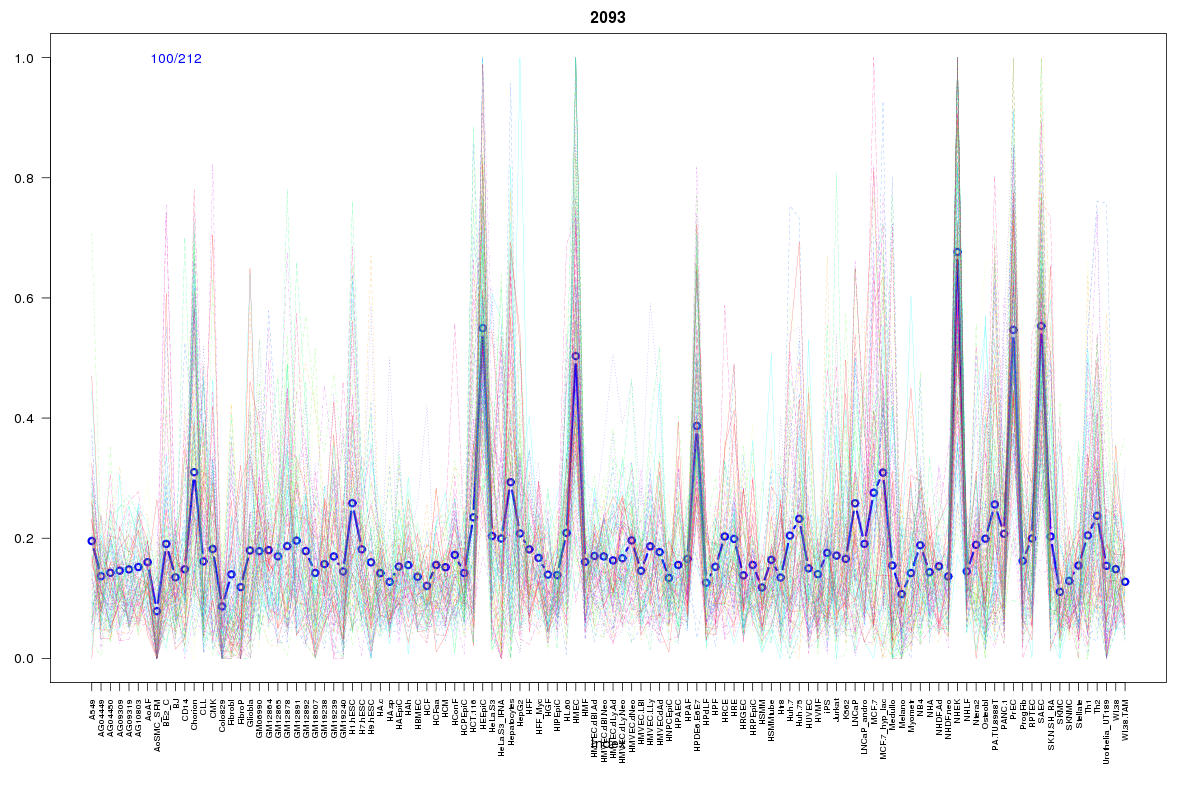 | 2093 | 1 |
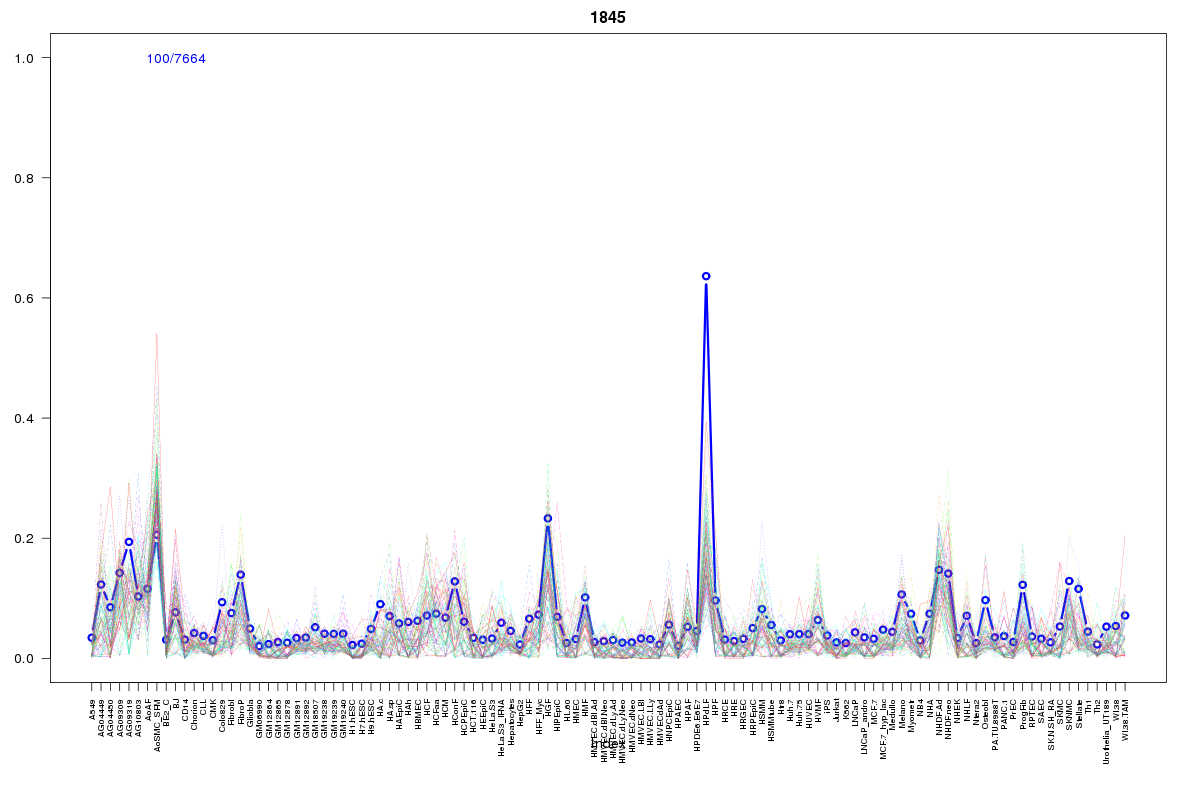 | 1845 | 1 |
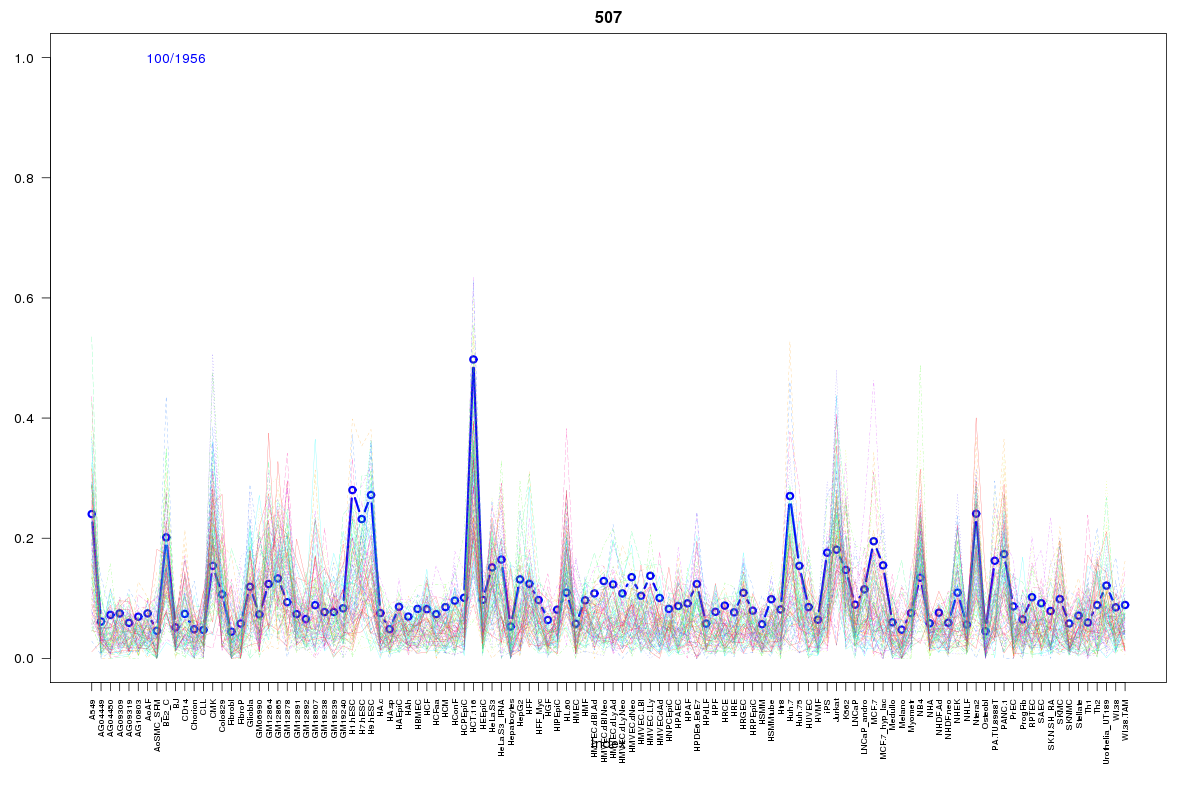 | 507 | 1 |
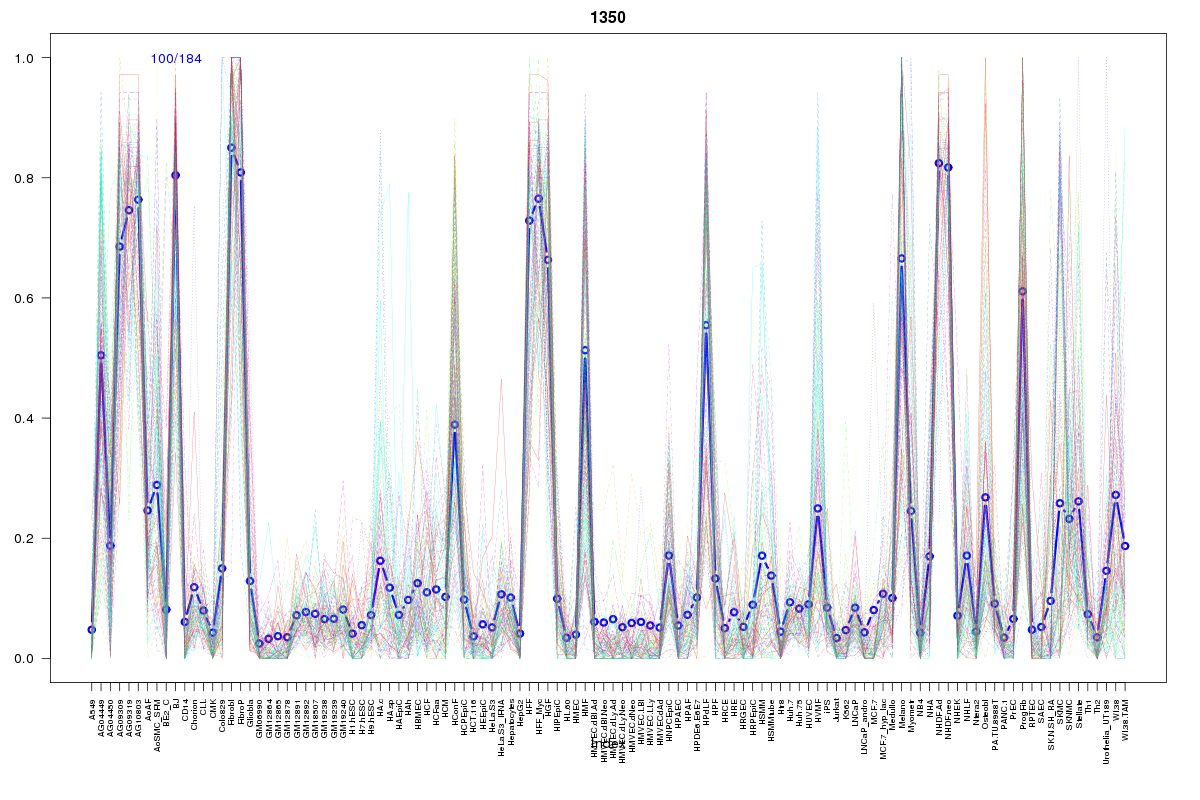 | 1350 | 1 |
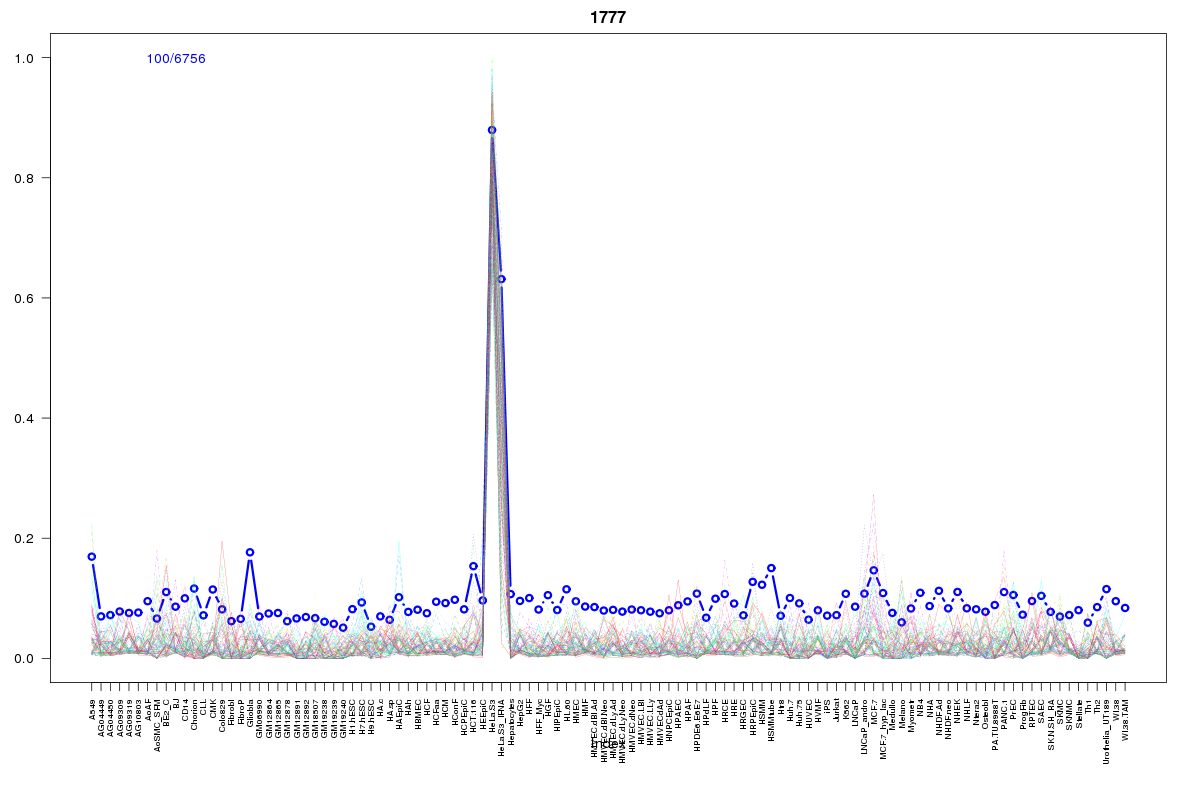 | 1777 | 1 |
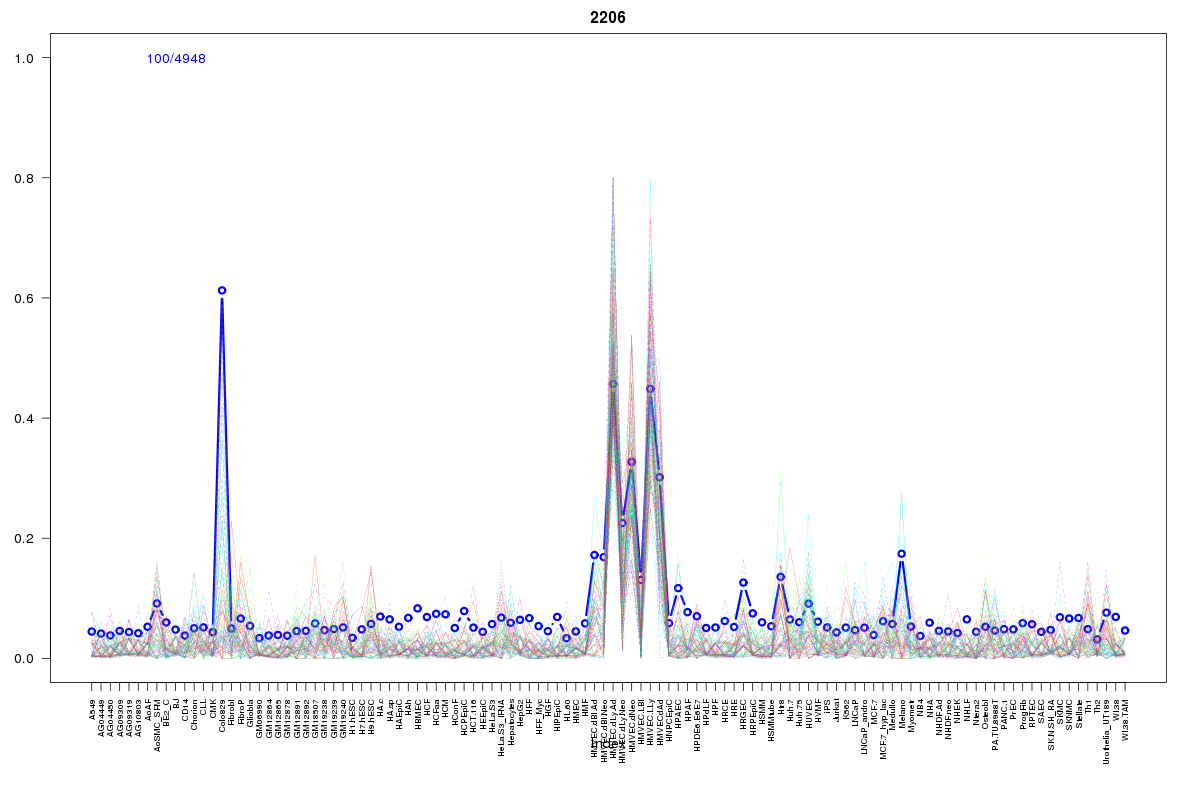 | 2206 | 1 |
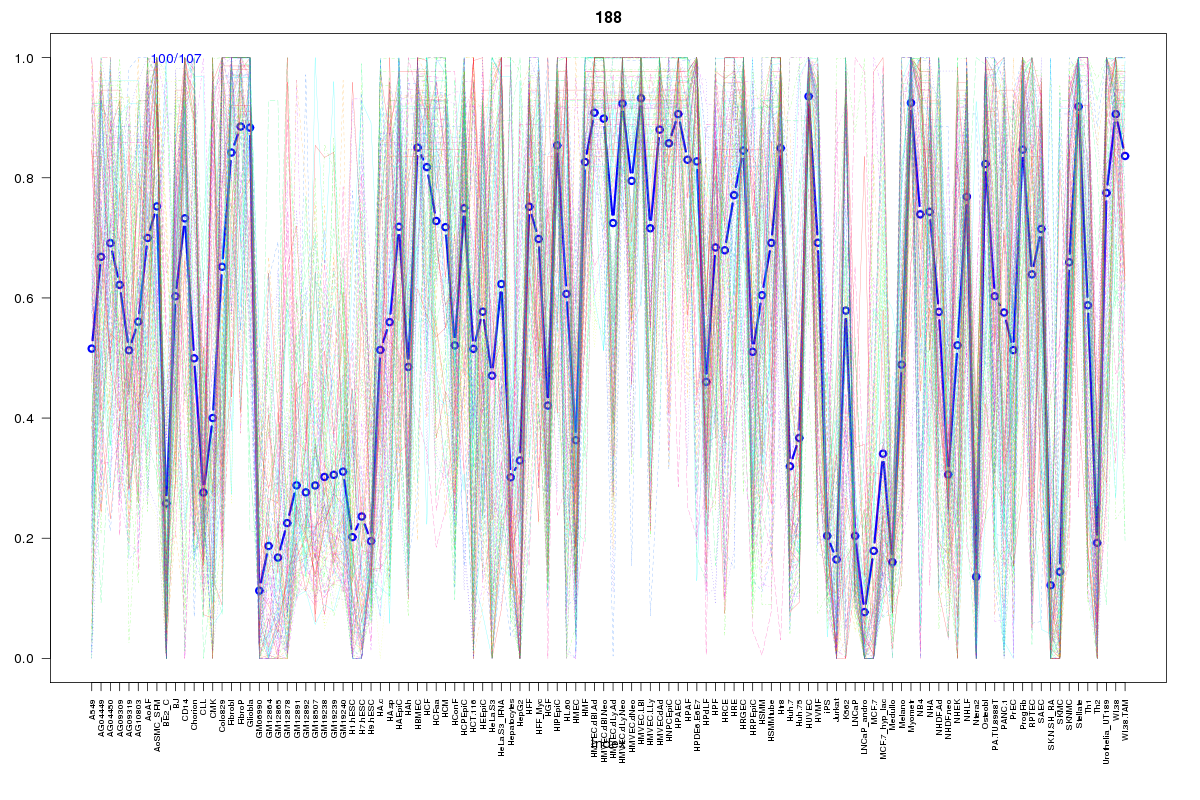 | 188 | 1 |
 | 2052 | 1 |
 | 1244 | 1 |
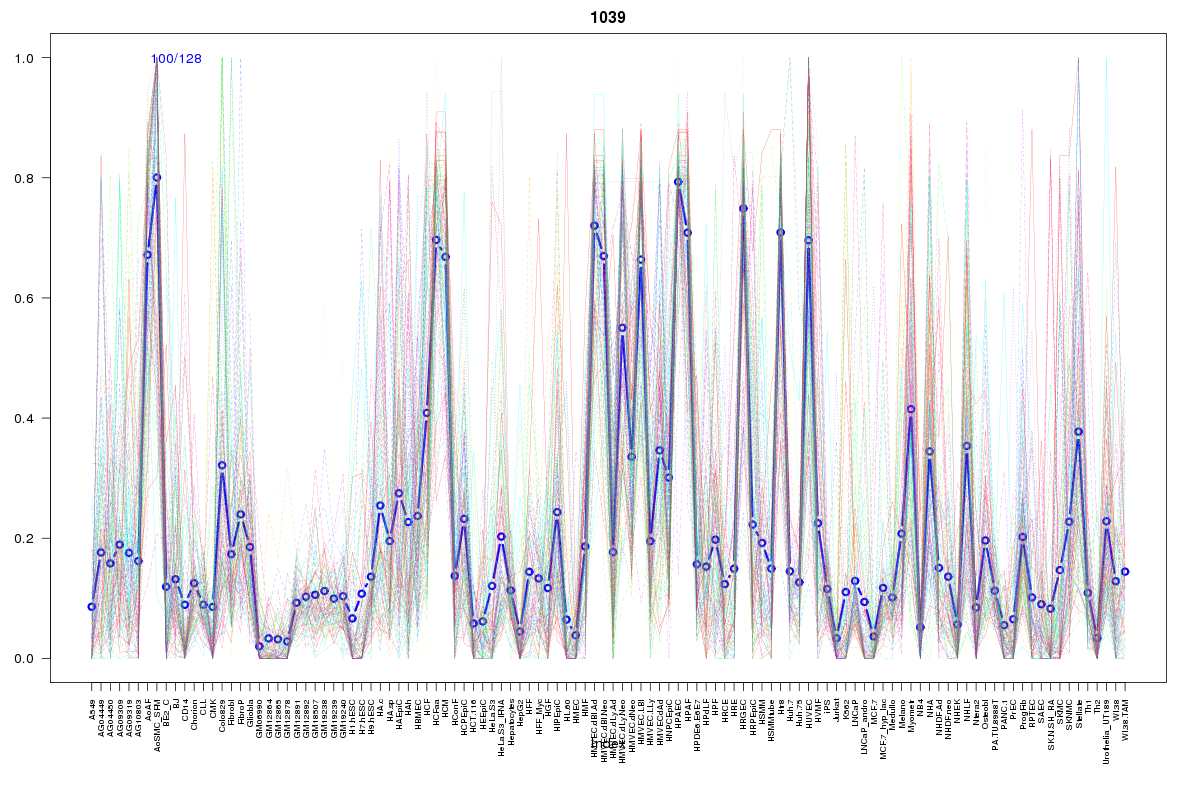 | 1039 | 1 |
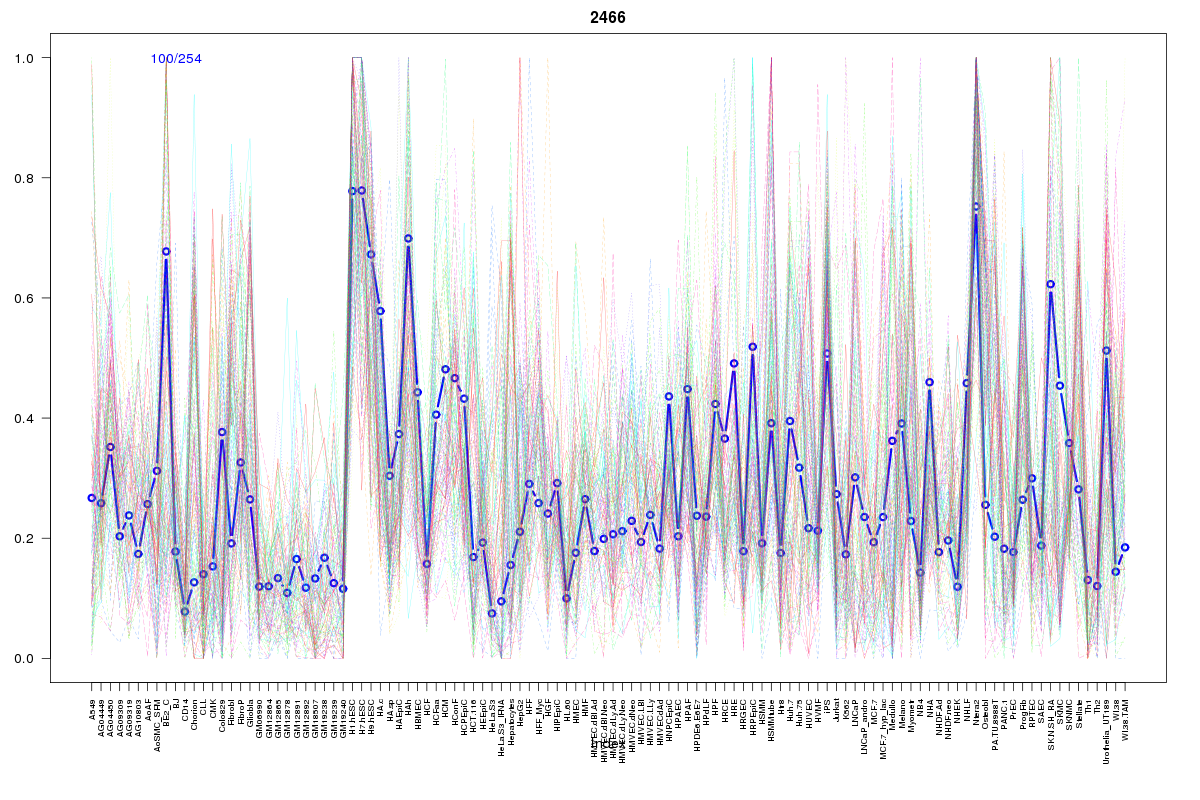 | 2466 | 1 |
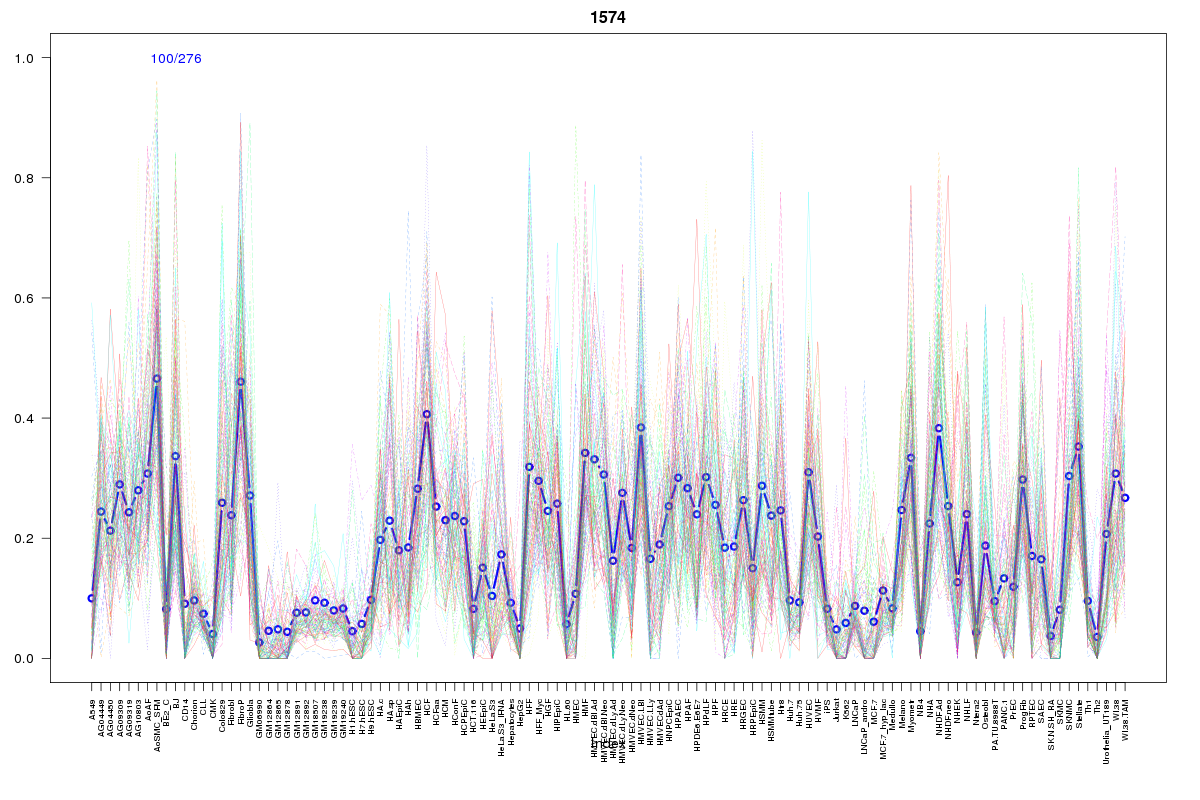 | 1574 | 1 |
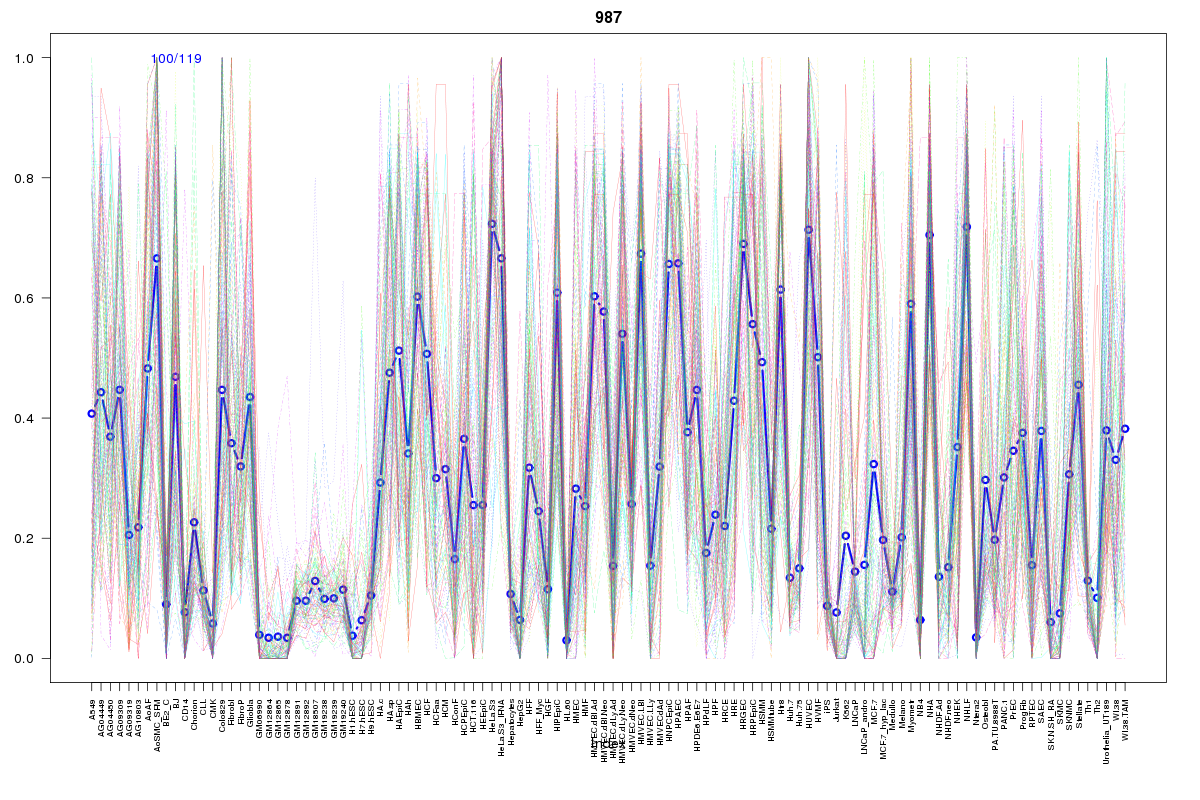 | 987 | 1 |
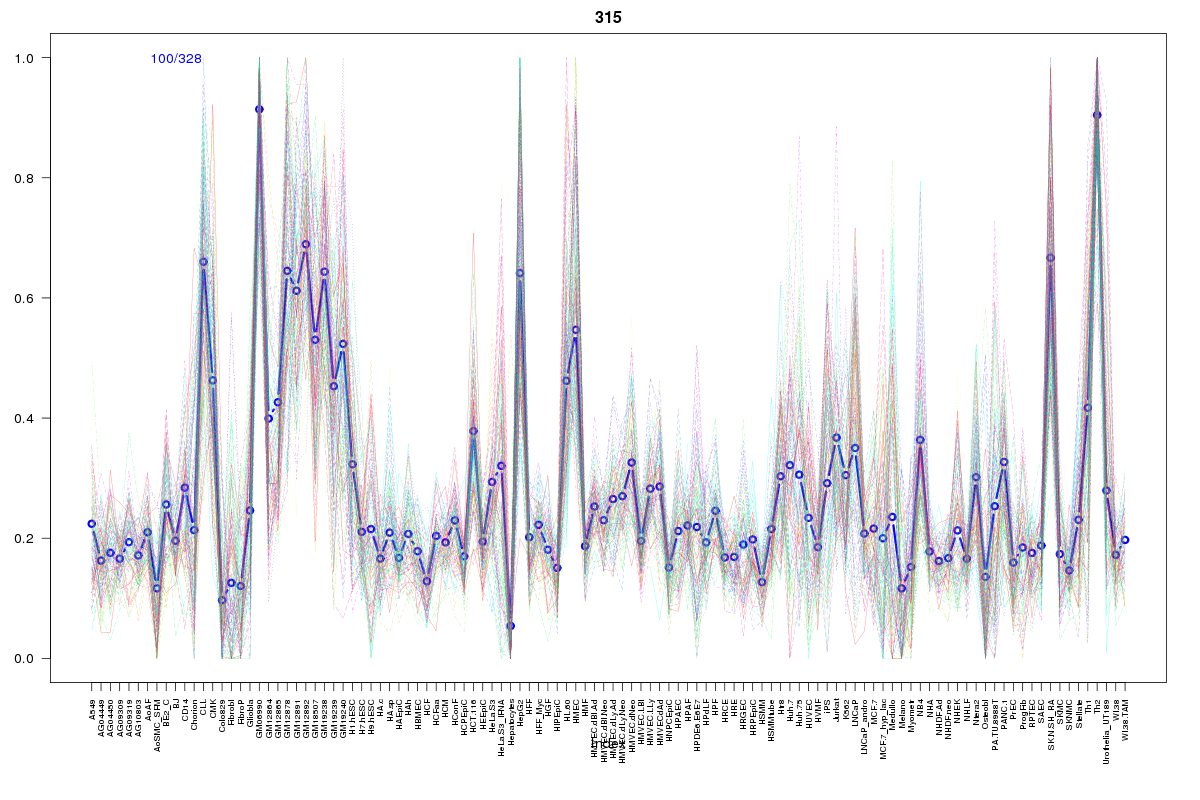 | 315 | 1 |
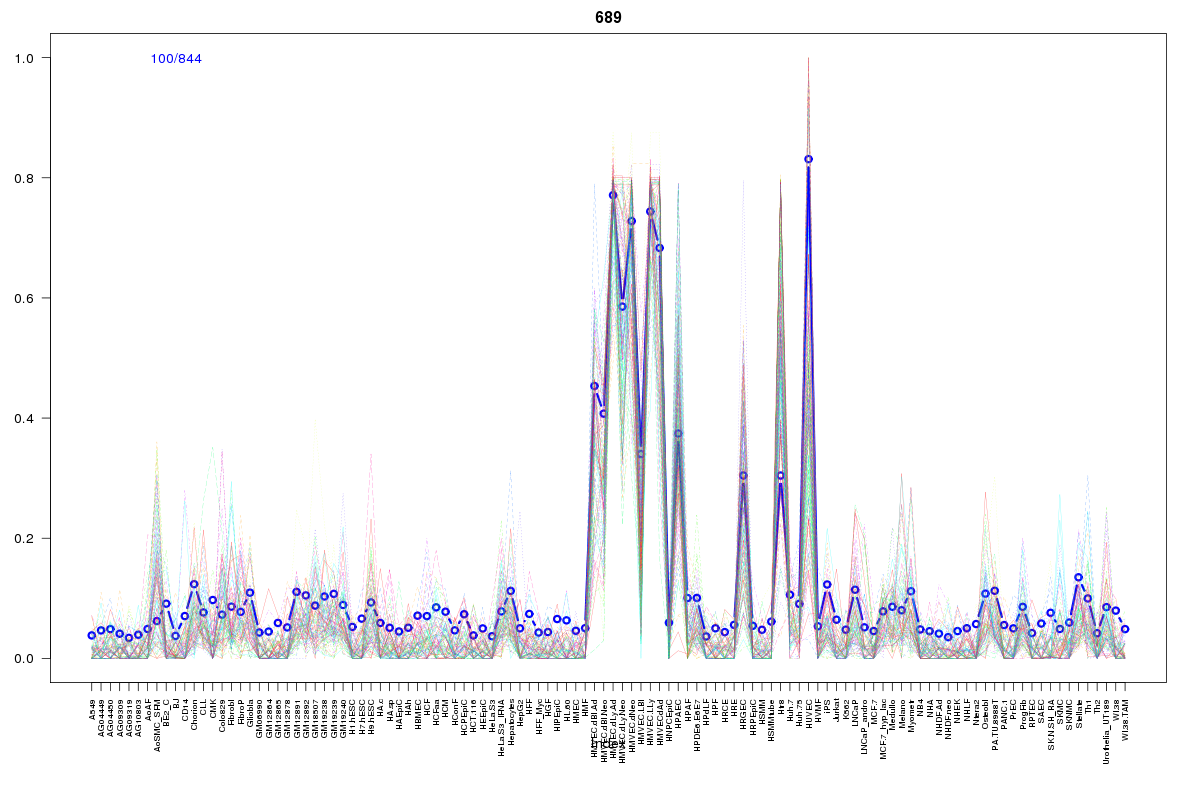 | 689 | 1 |
 | 15 | 1 |
 | 464 | 1 |
 | 927 | 1 |
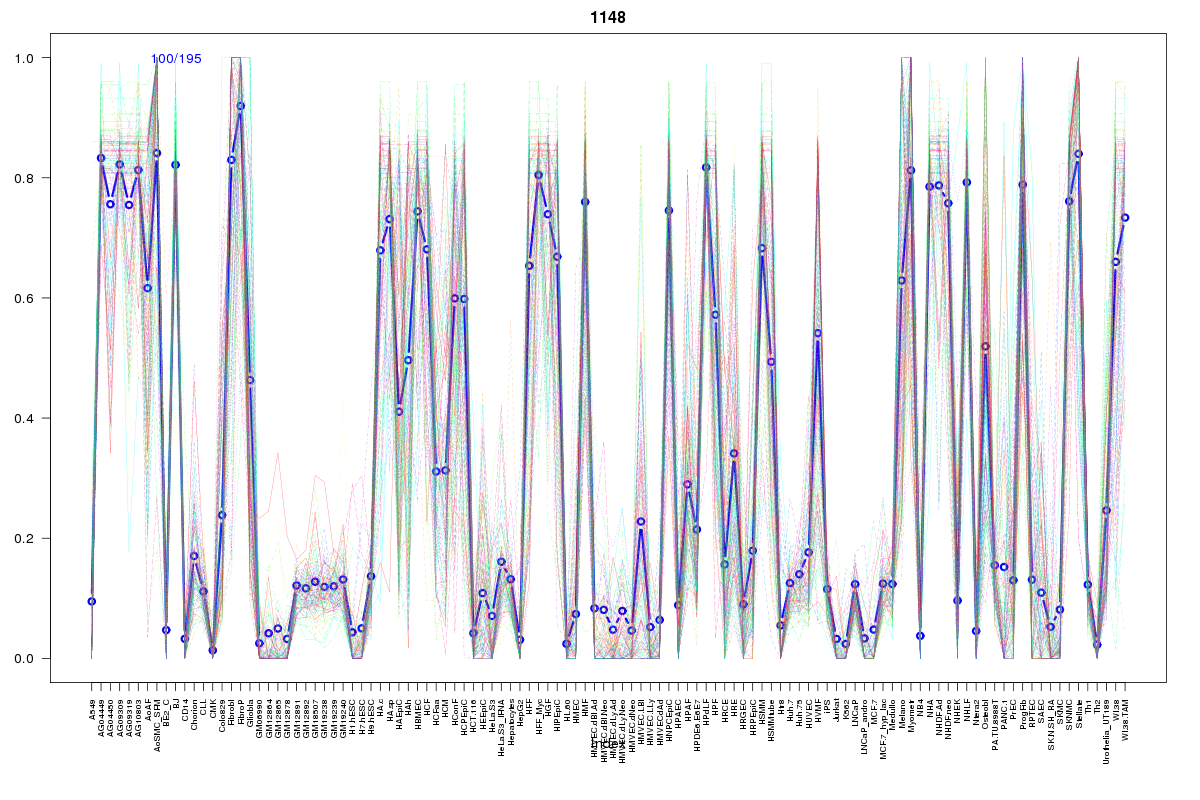 | 1148 | 1 |
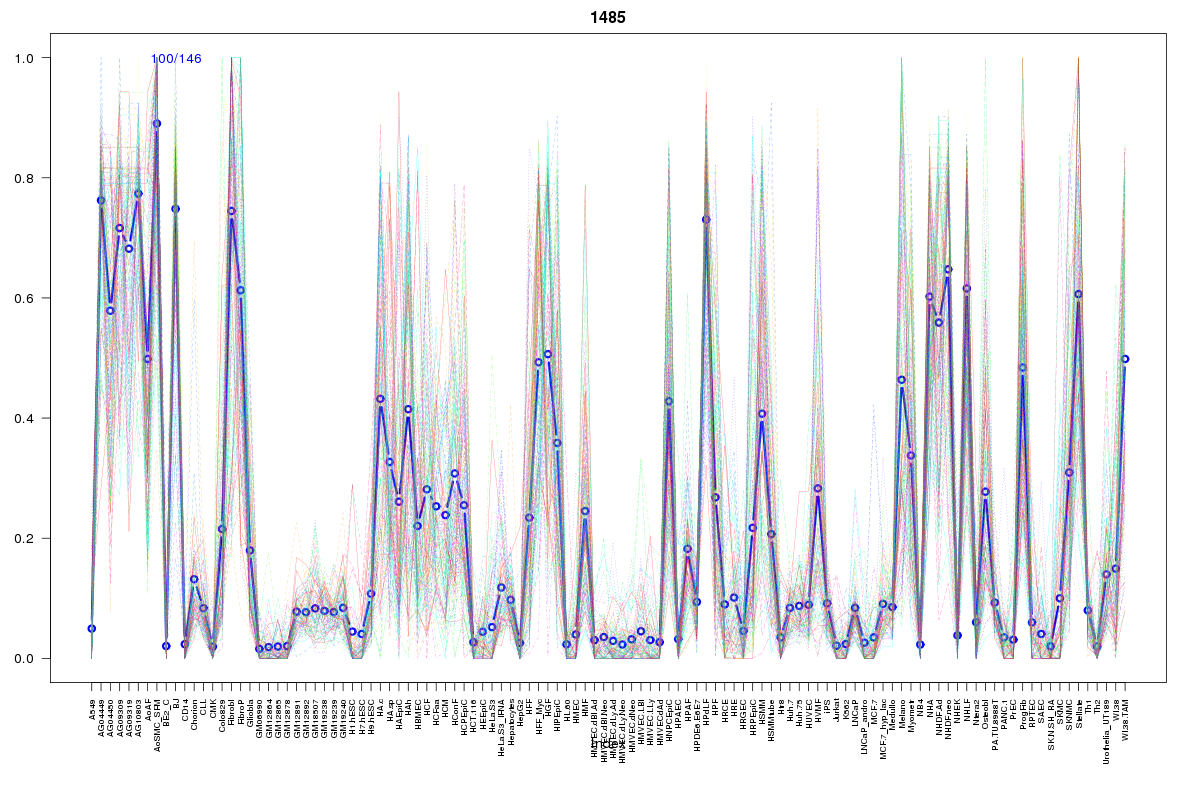 | 1485 | 1 |
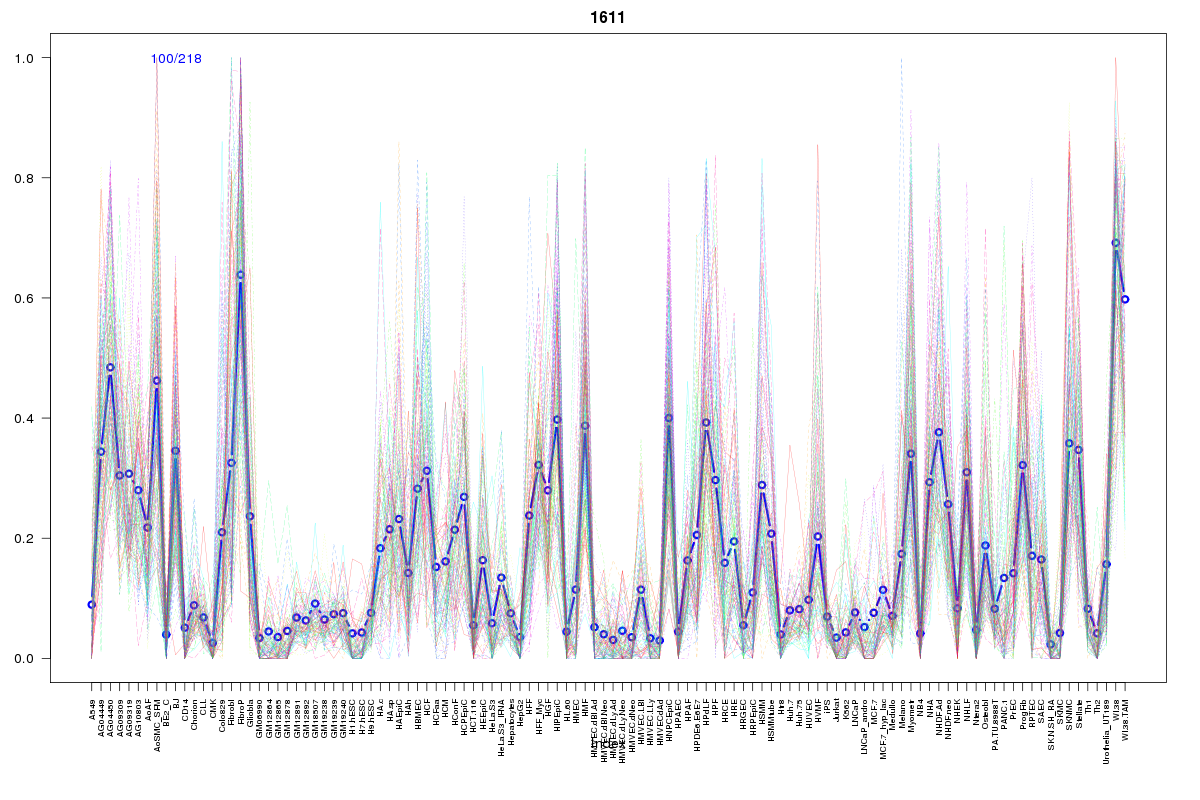 | 1611 | 1 |
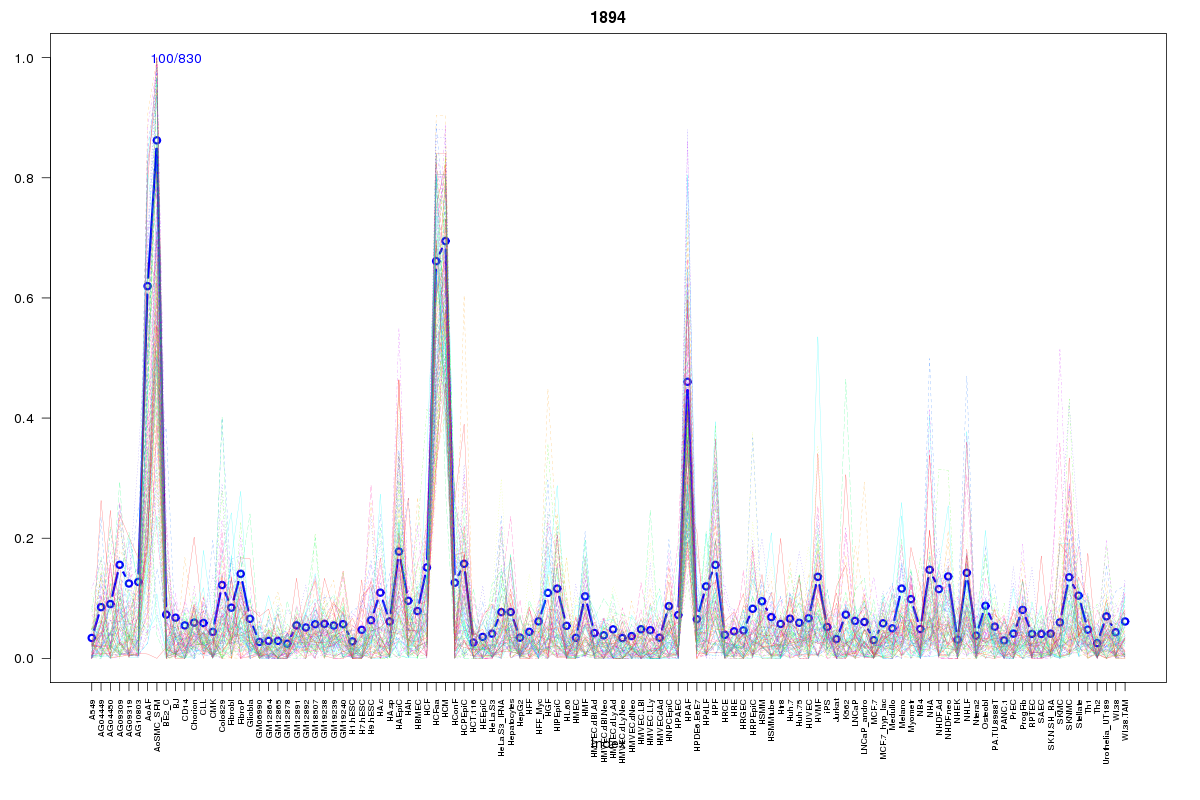 | 1894 | 1 |
Resources
BED file downloads
Connects to 70 DHS sitesTop 10 Correlated DHS Sites
p-values indiciate significant higher or lower correlationExternal Databases
UCSCEnsembl (ENSG00000133657)