Gene: MEX3A
chr1: 156041803-156051789Expression Profile
(log scale)
Graphical Connections
Distribution of linked clusters:
You may find it interesting if many of the connected DHS sites belong to the same cluster.| Cluster Profile | Cluster ID | Number of DHS sites in this cluster |
|---|---|---|
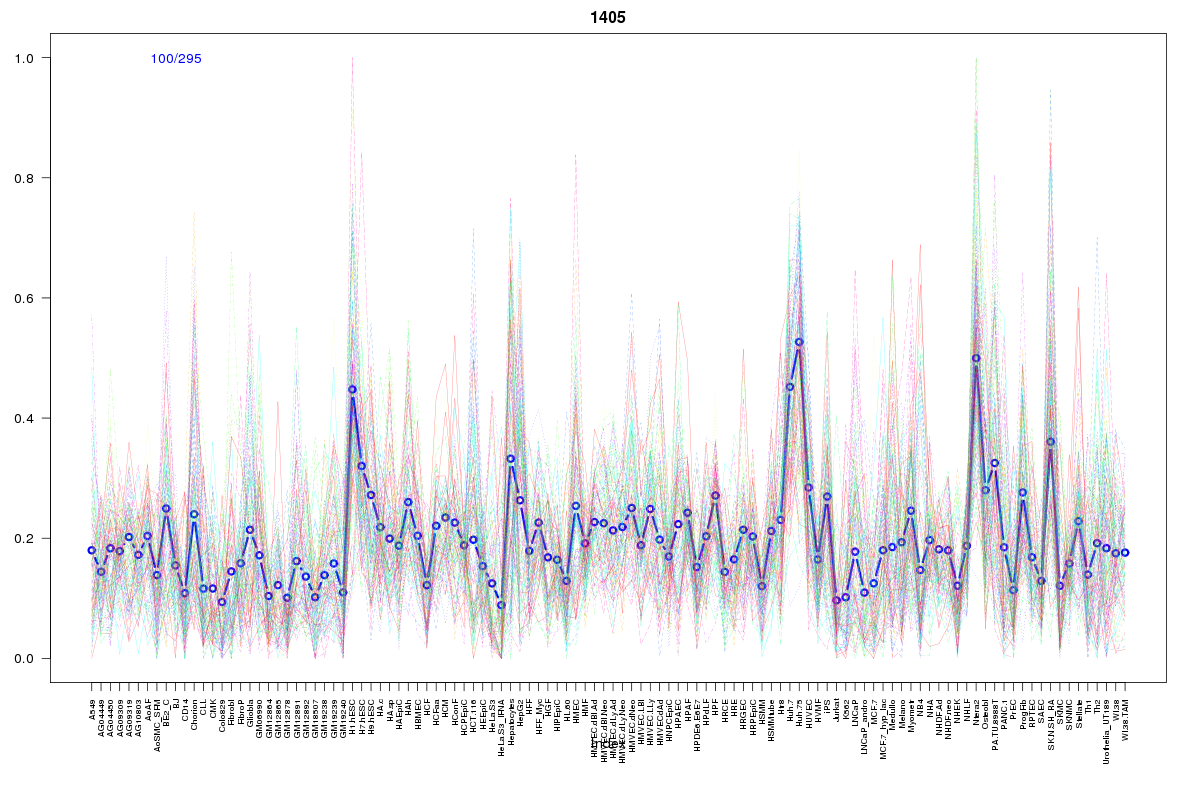 | 1405 | 3 |
 | 469 | 2 |
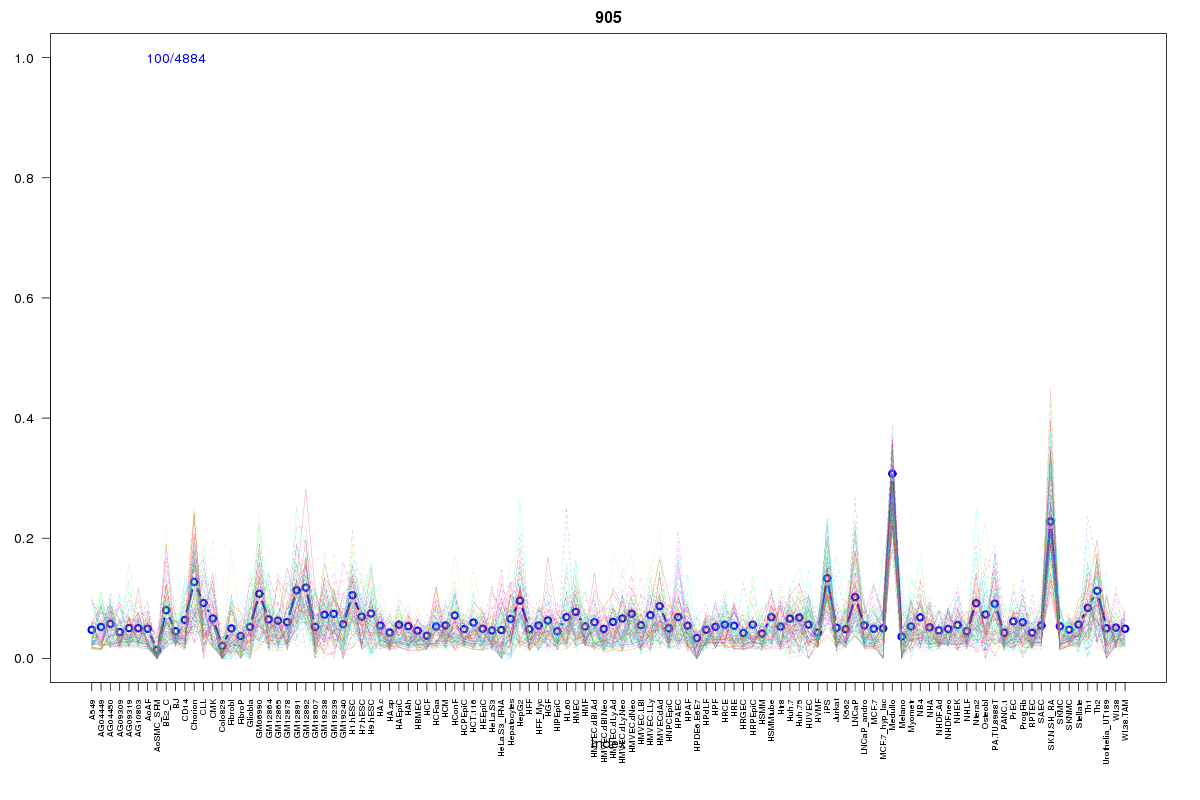 | 905 | 2 |
 | 10 | 2 |
 | 130 | 2 |
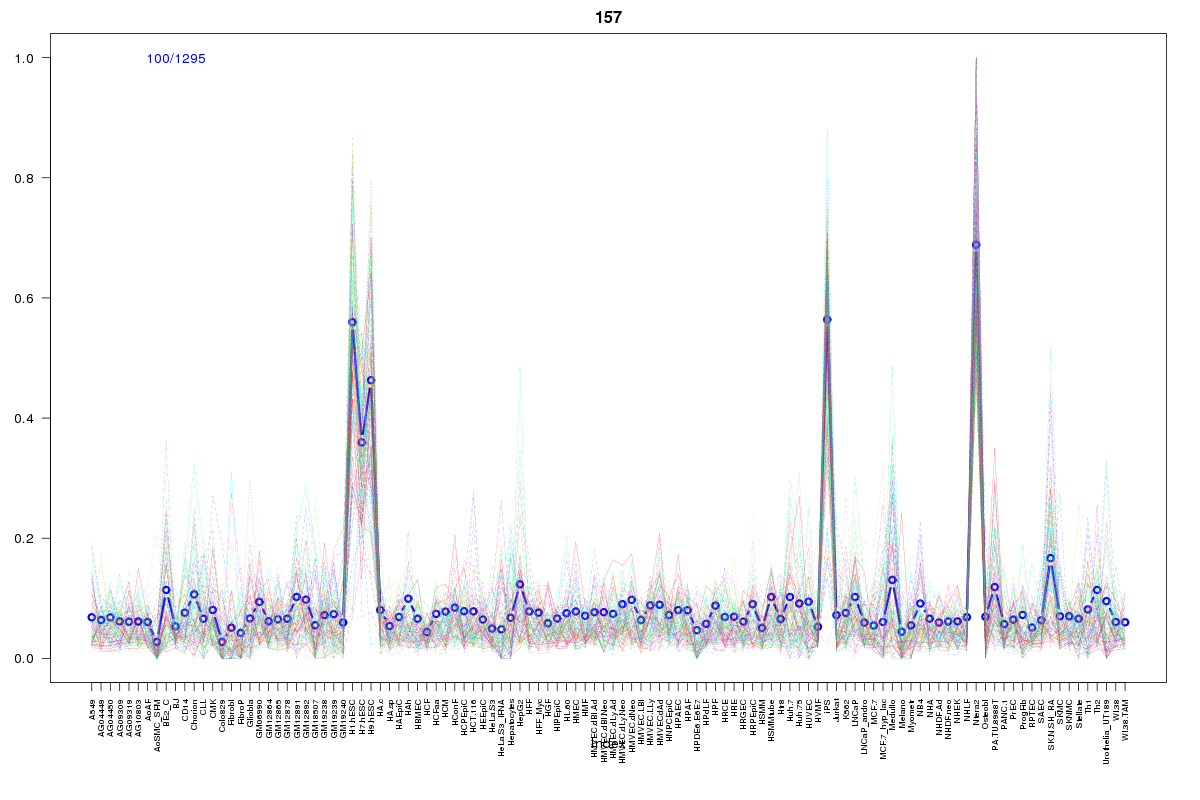 | 157 | 2 |
 | 421 | 1 |
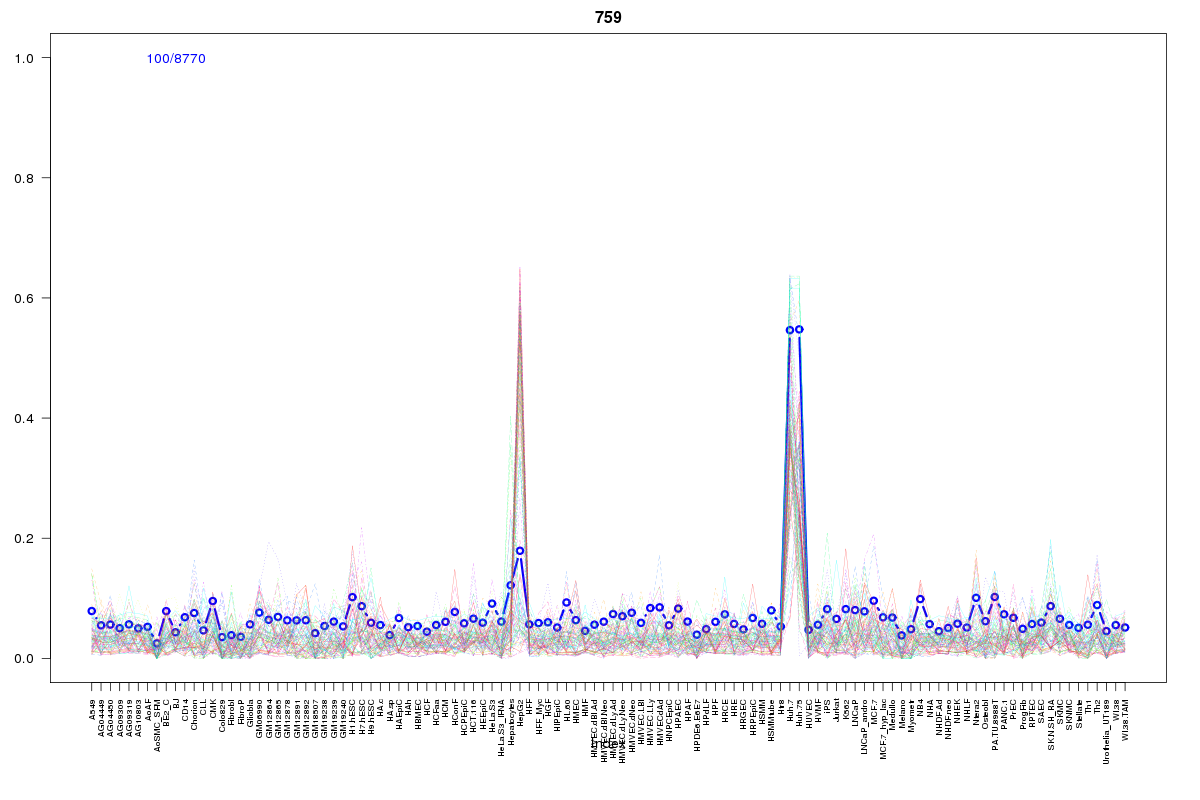 | 759 | 1 |
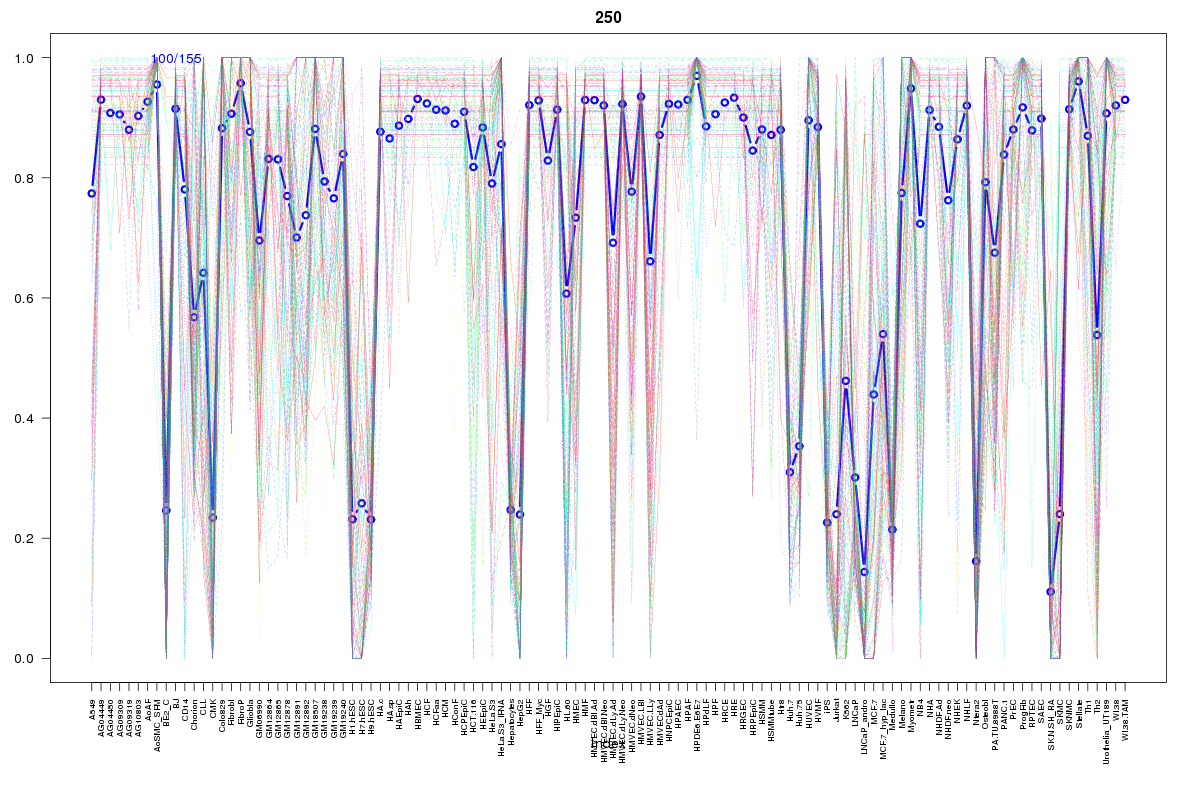 | 250 | 1 |
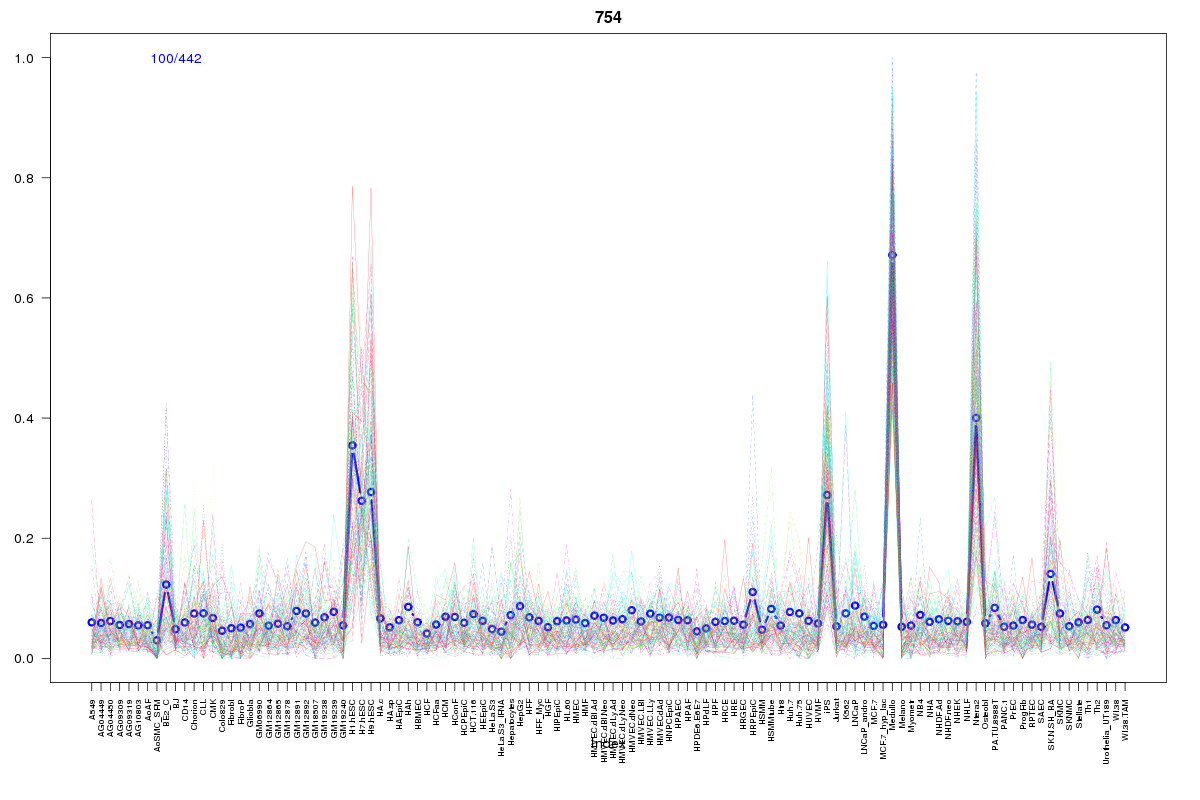 | 754 | 1 |
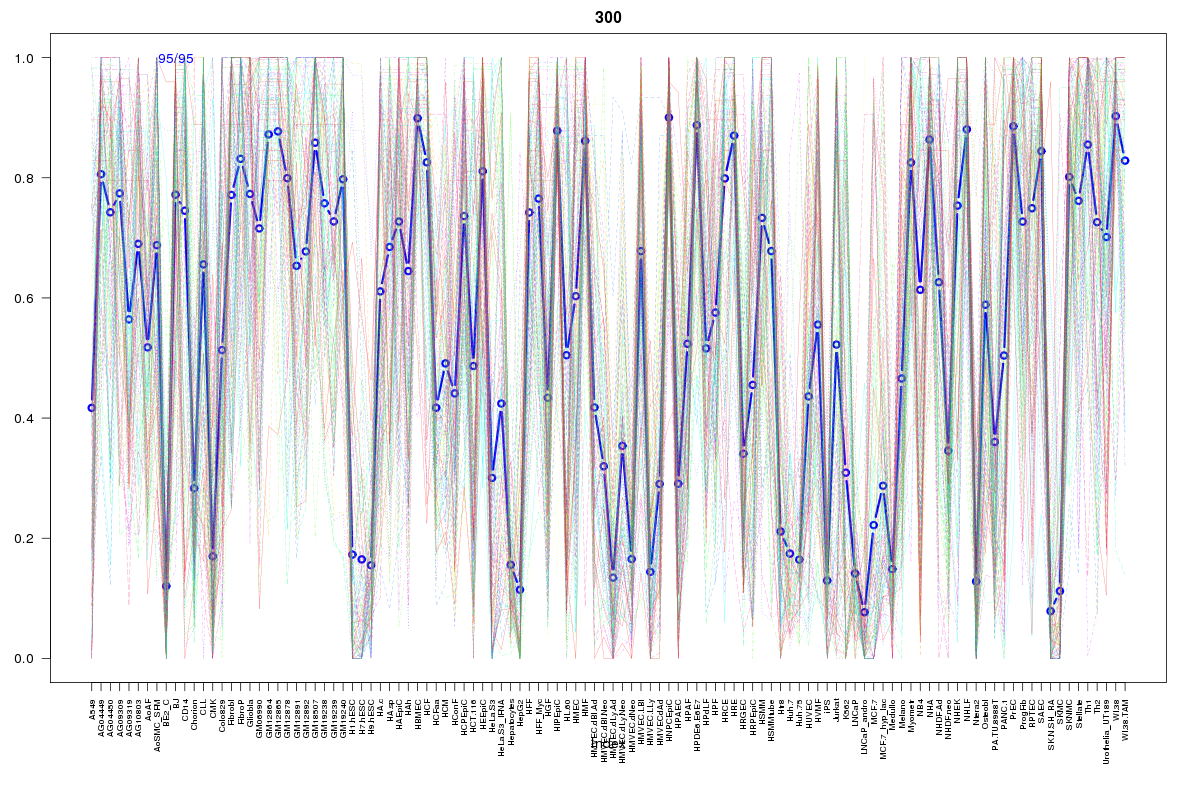 | 300 | 1 |
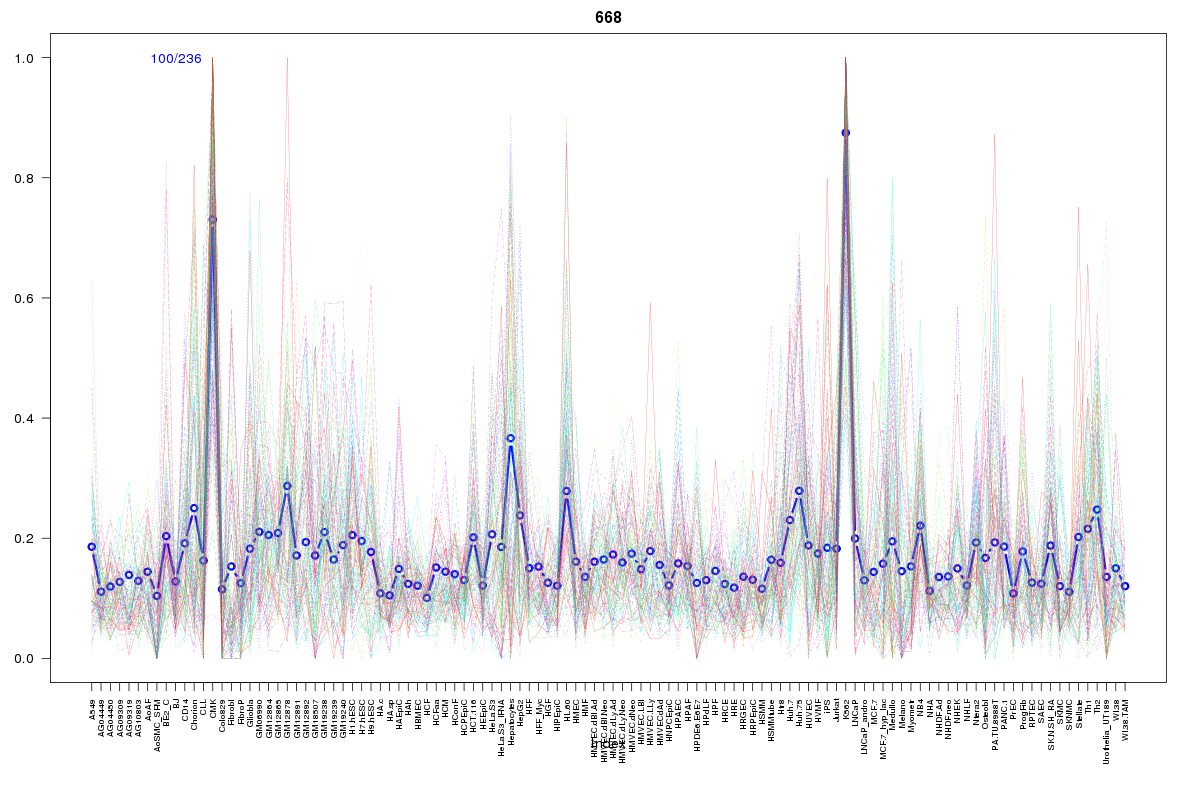 | 668 | 1 |
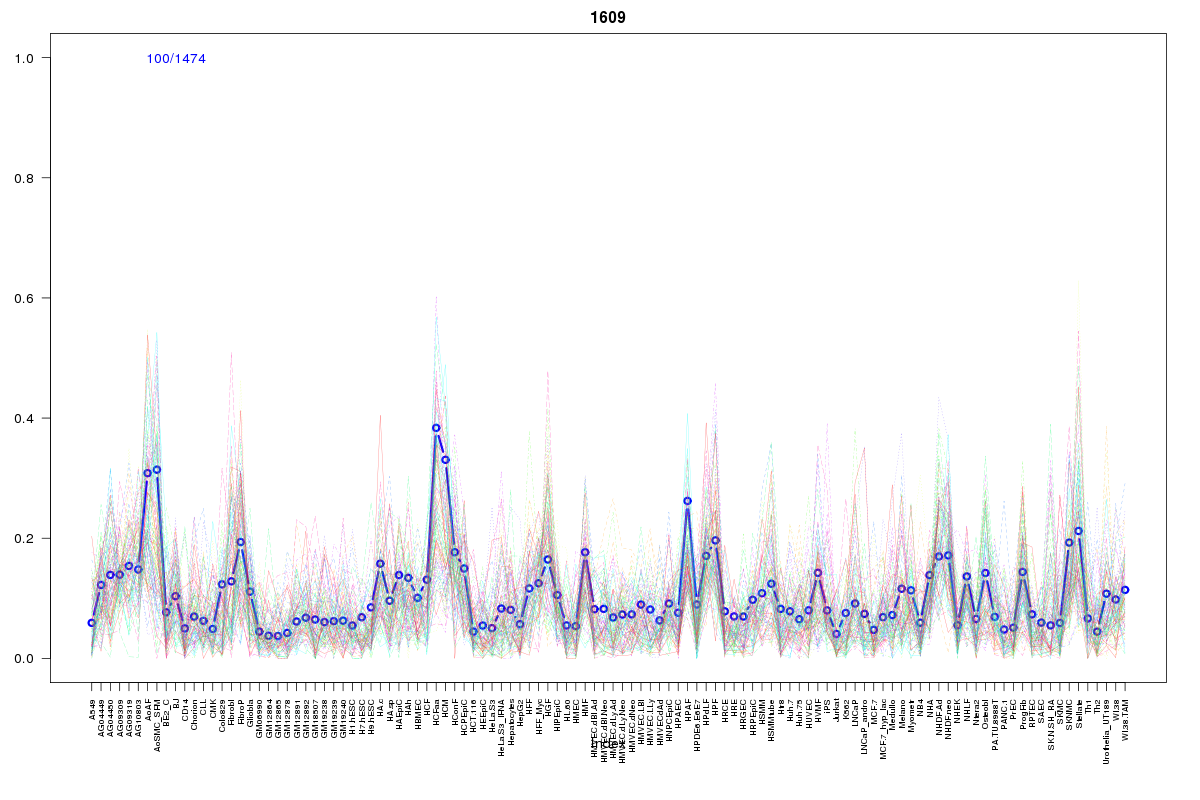 | 1609 | 1 |
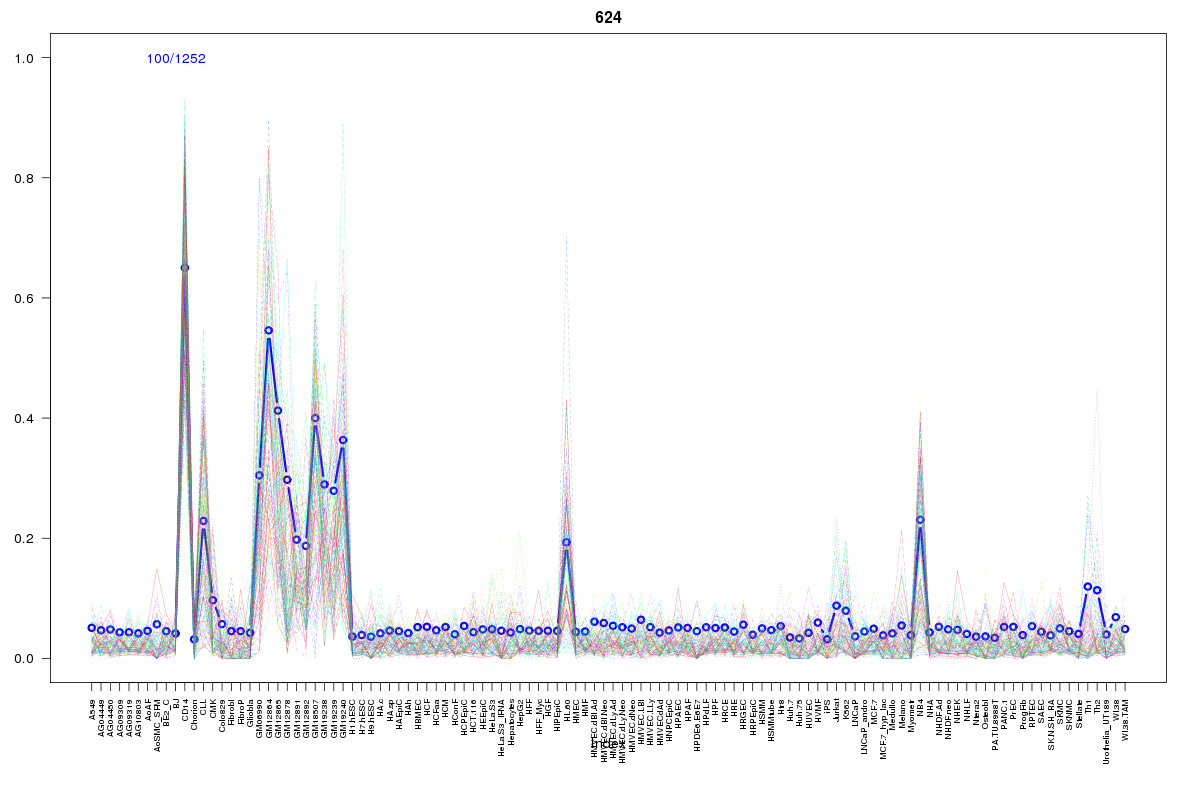 | 624 | 1 |
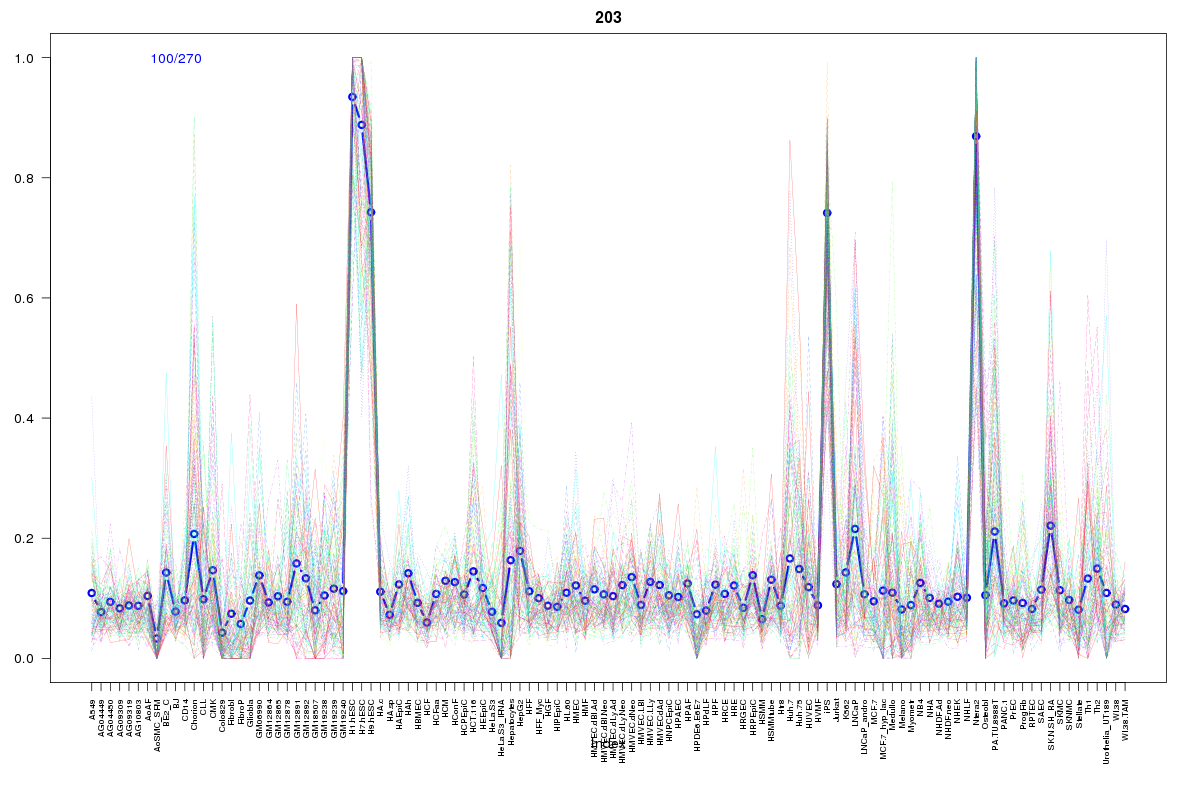 | 203 | 1 |
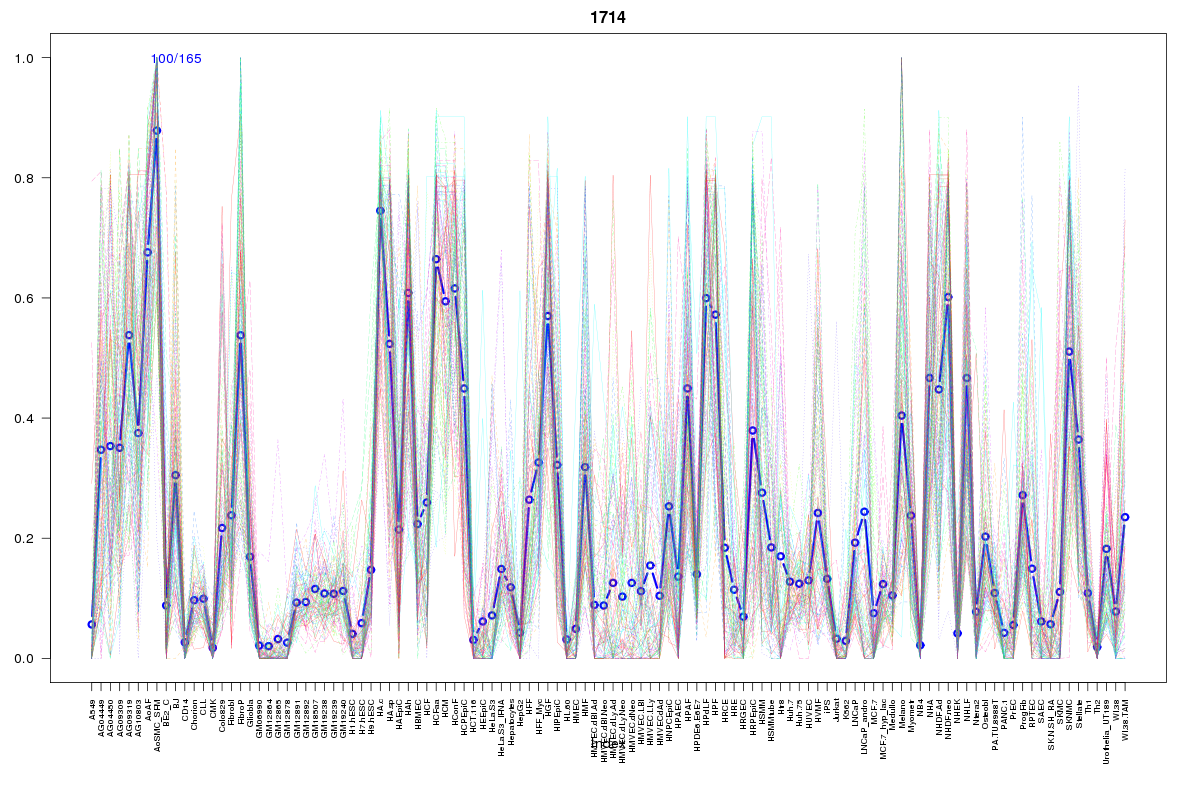 | 1714 | 1 |
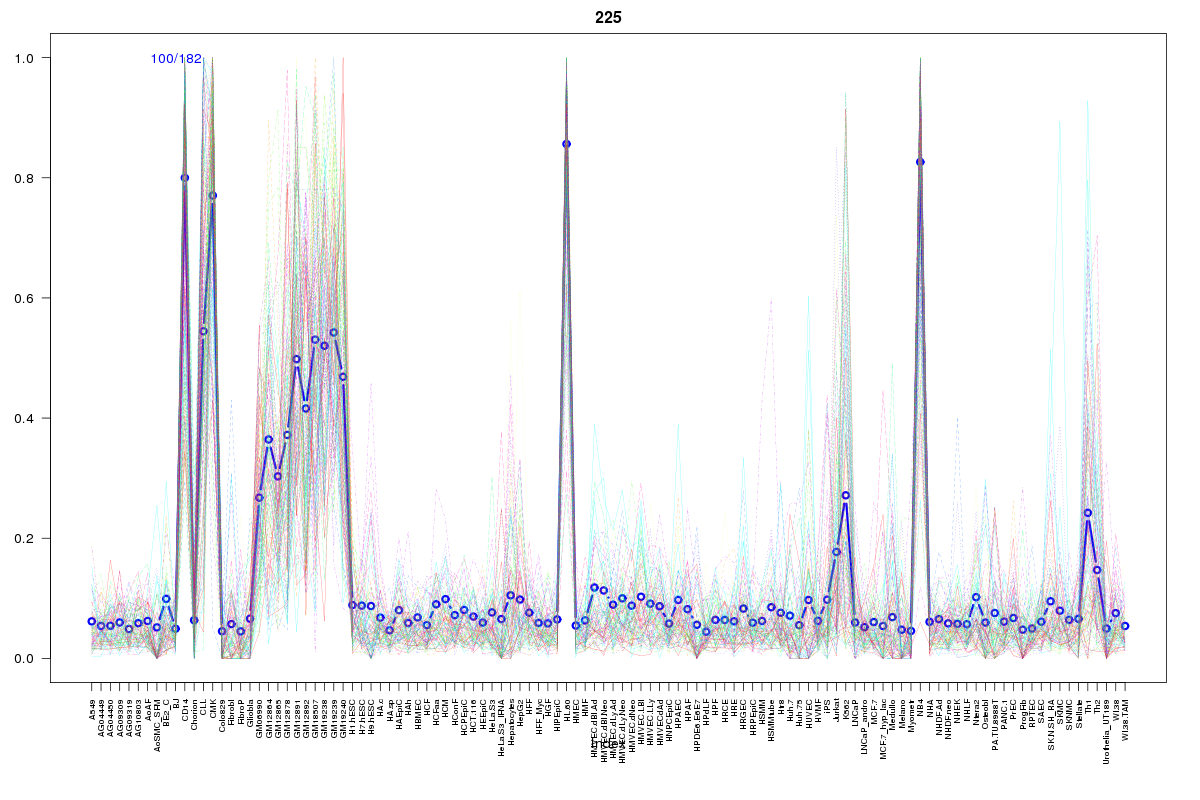 | 225 | 1 |
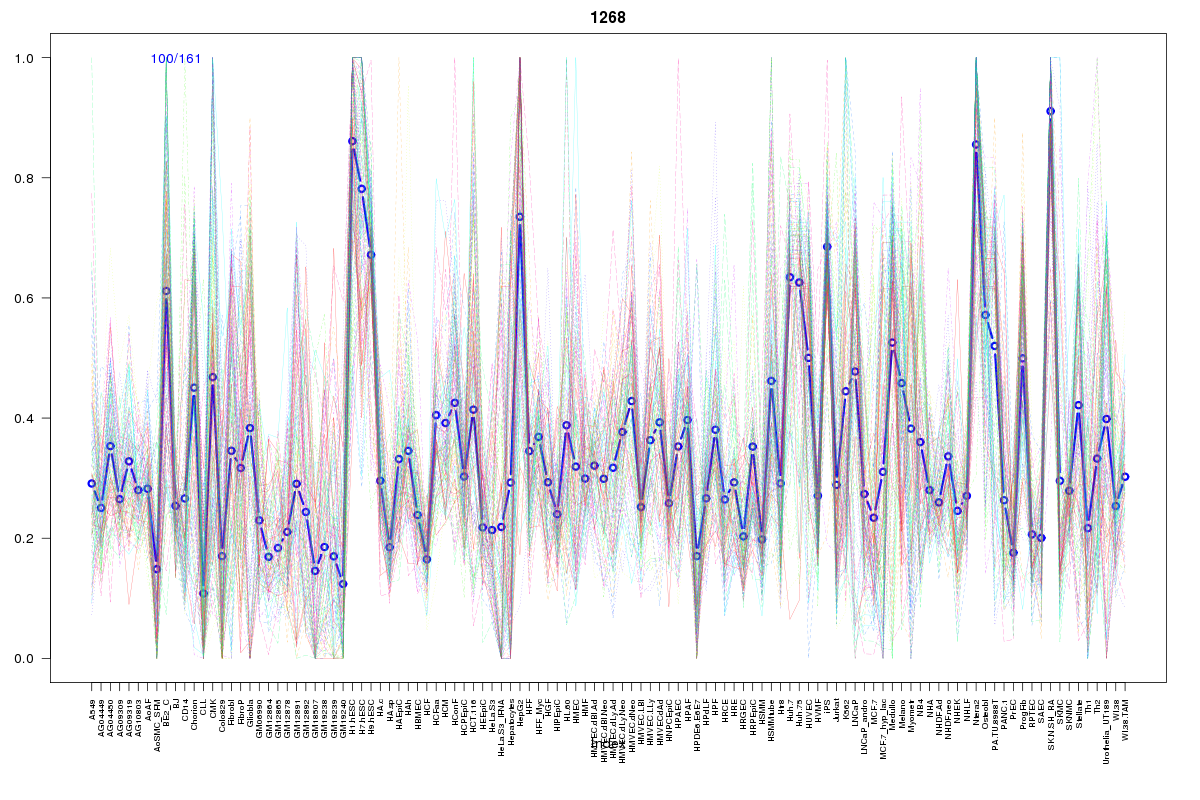 | 1268 | 1 |
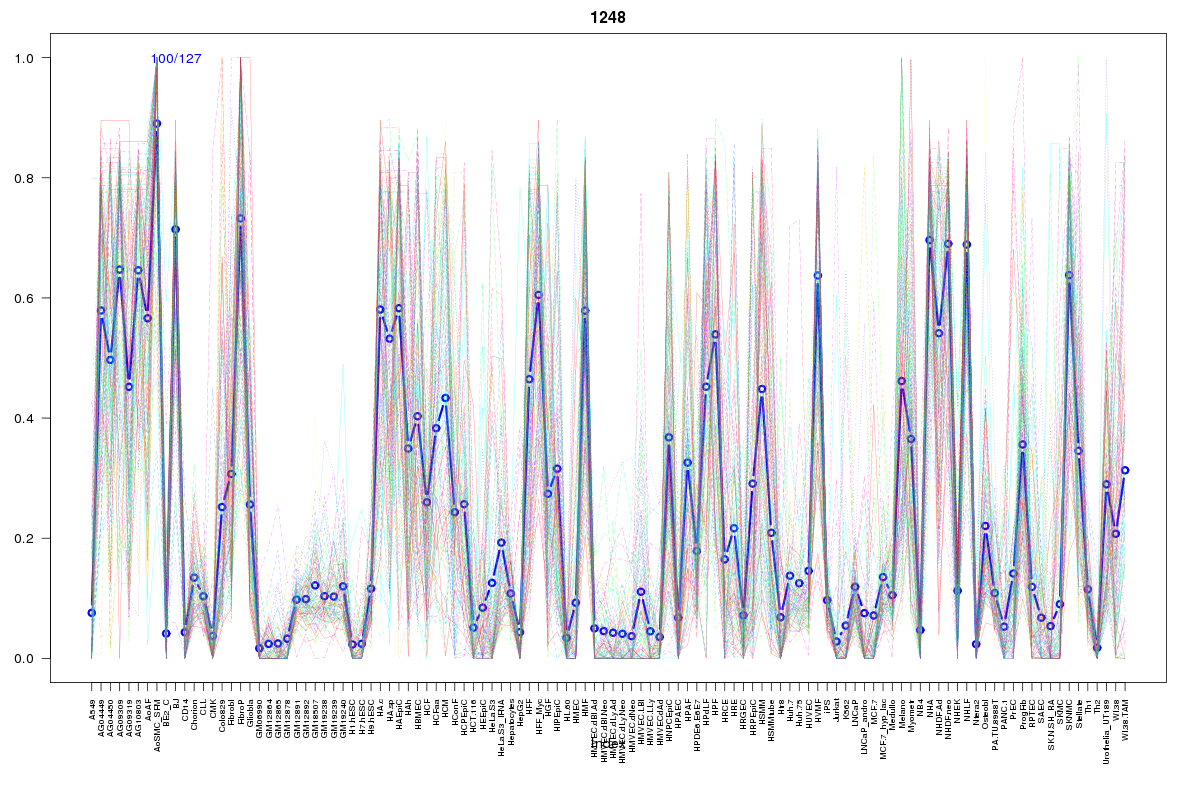 | 1248 | 1 |
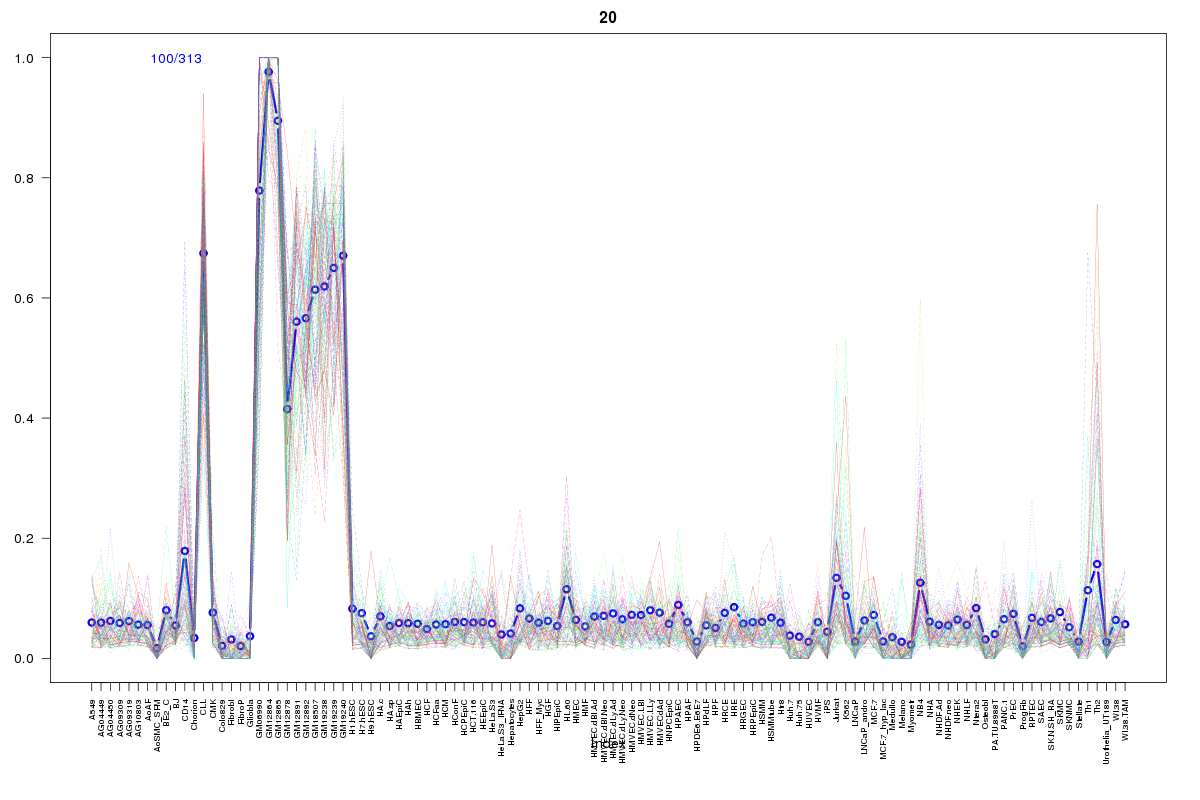 | 20 | 1 |
 | 952 | 1 |
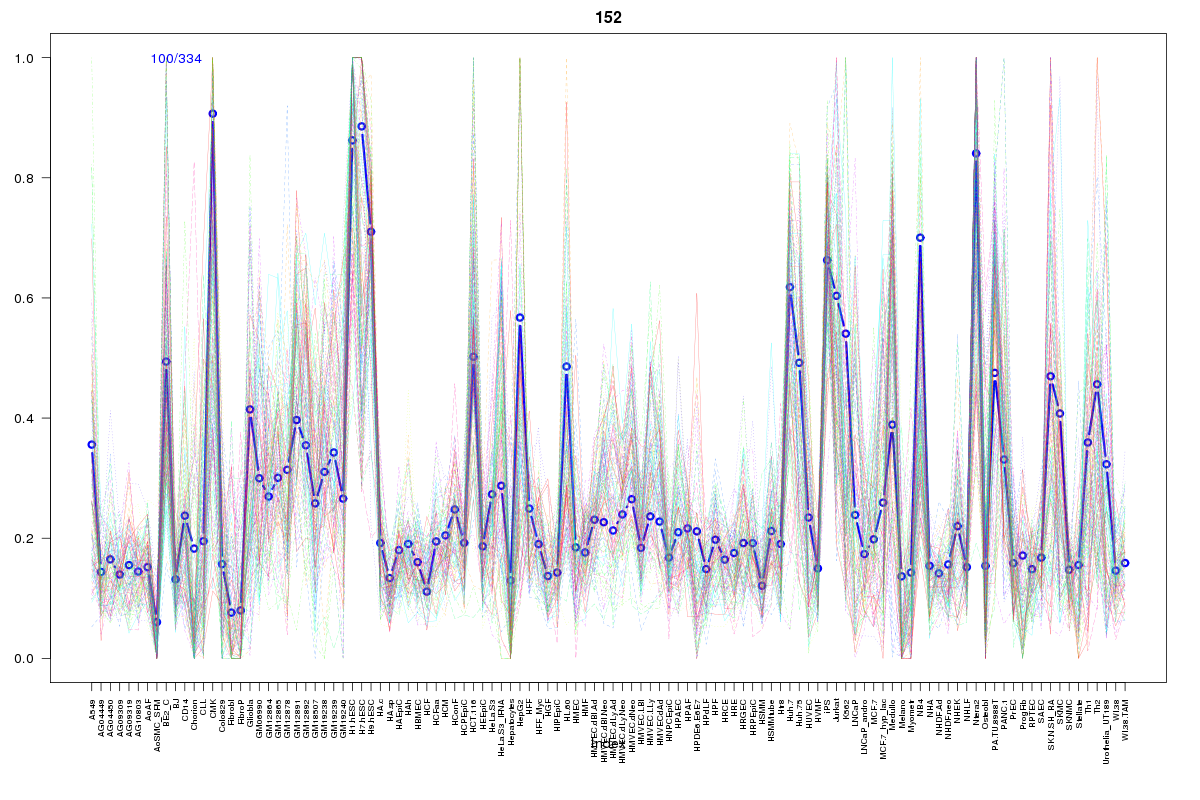 | 152 | 1 |
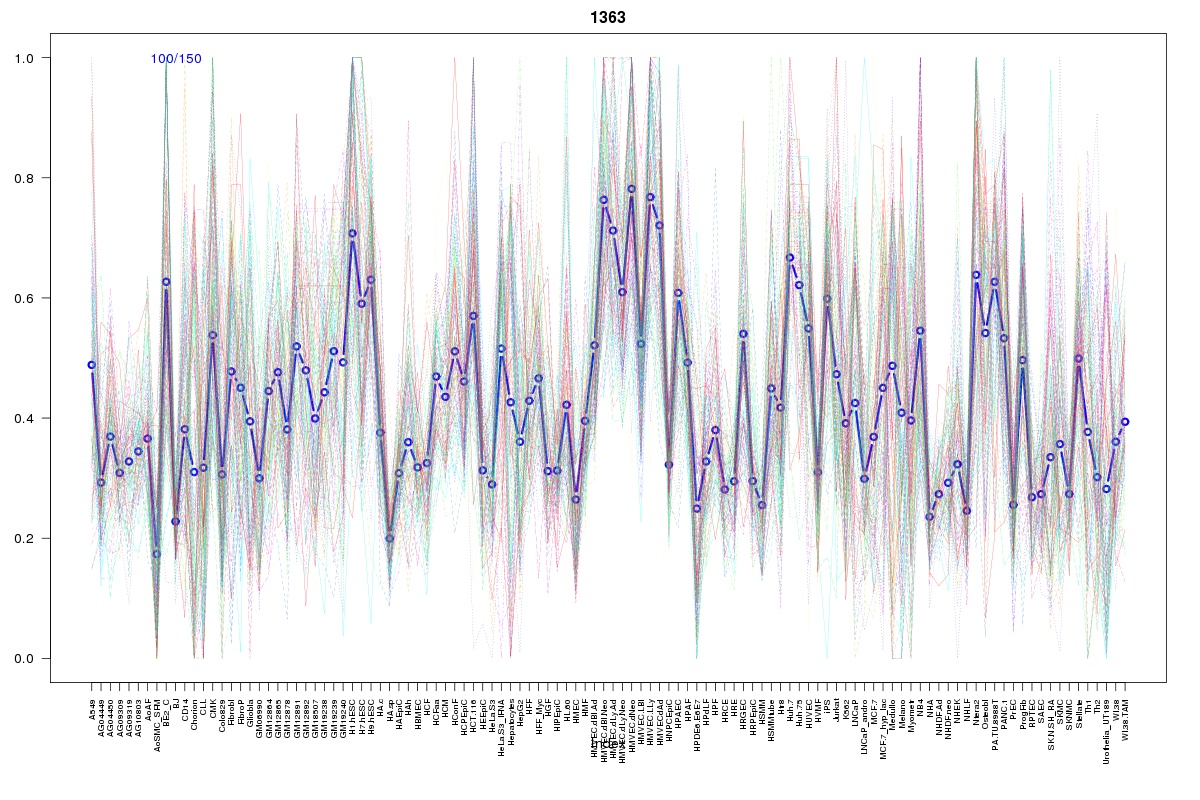 | 1363 | 1 |
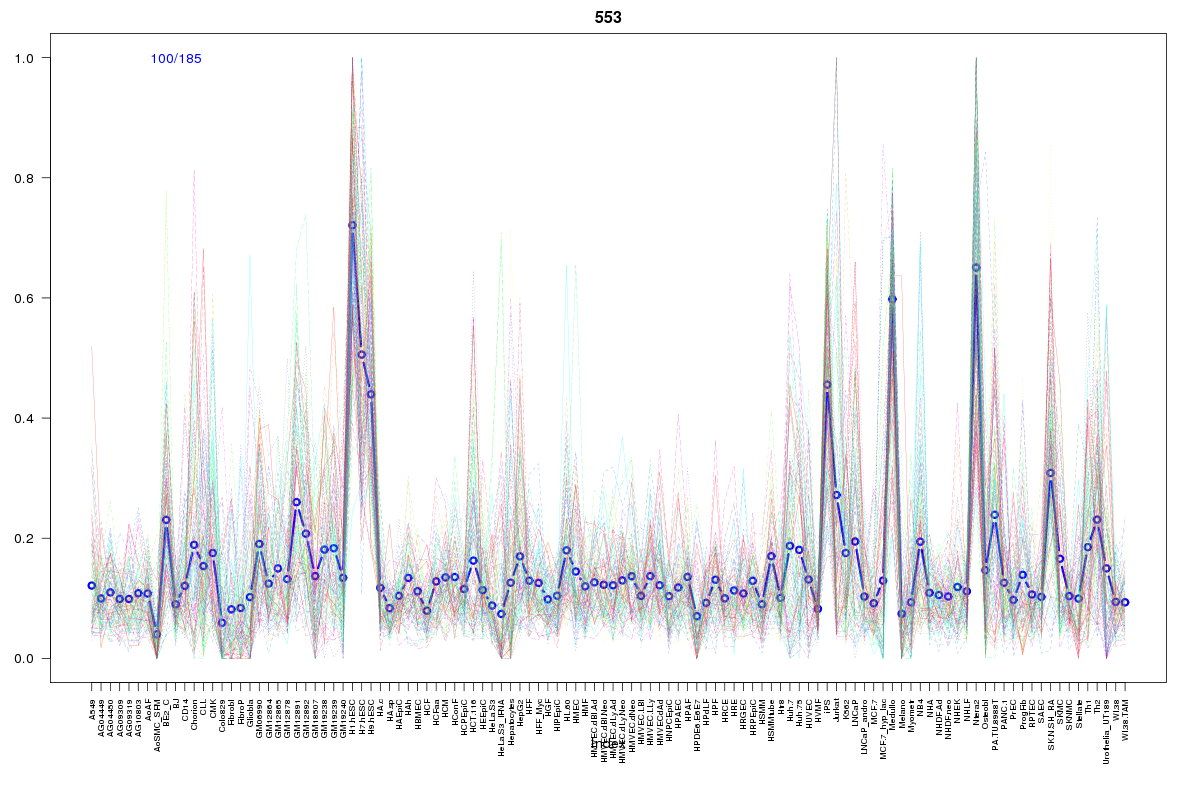 | 553 | 1 |
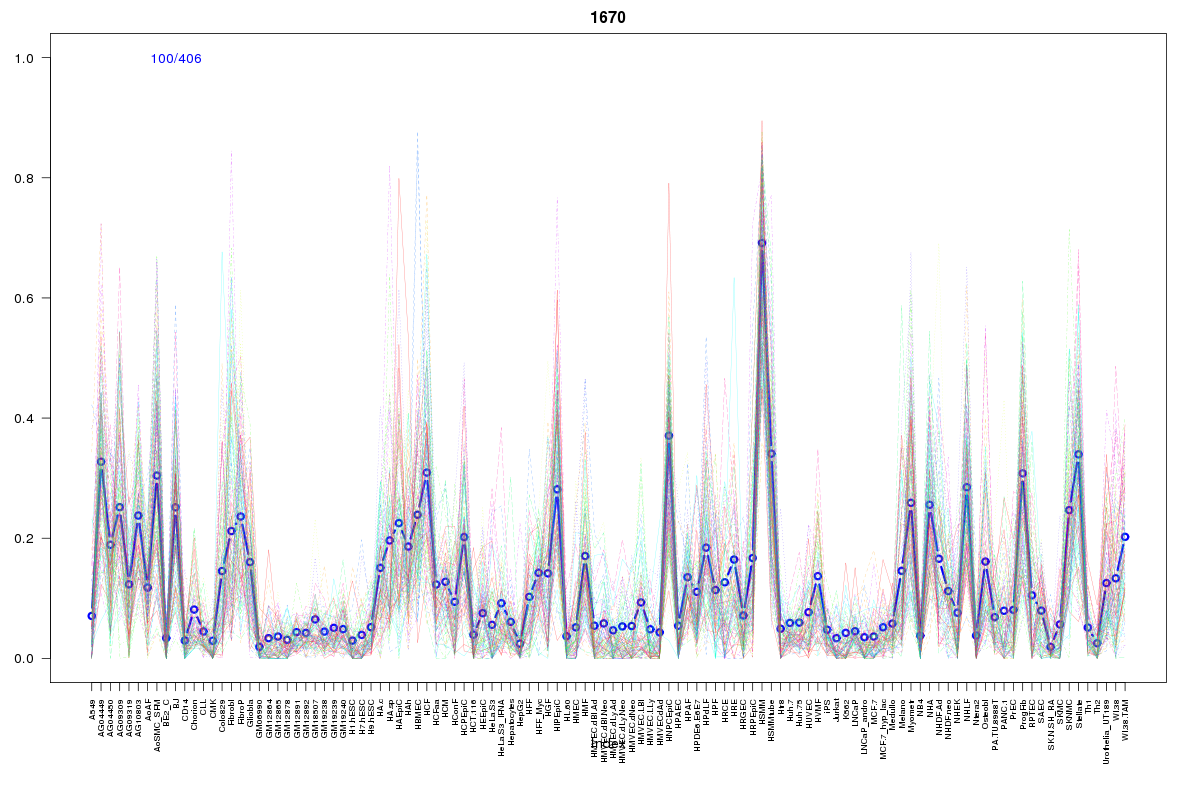 | 1670 | 1 |
 | 110 | 1 |
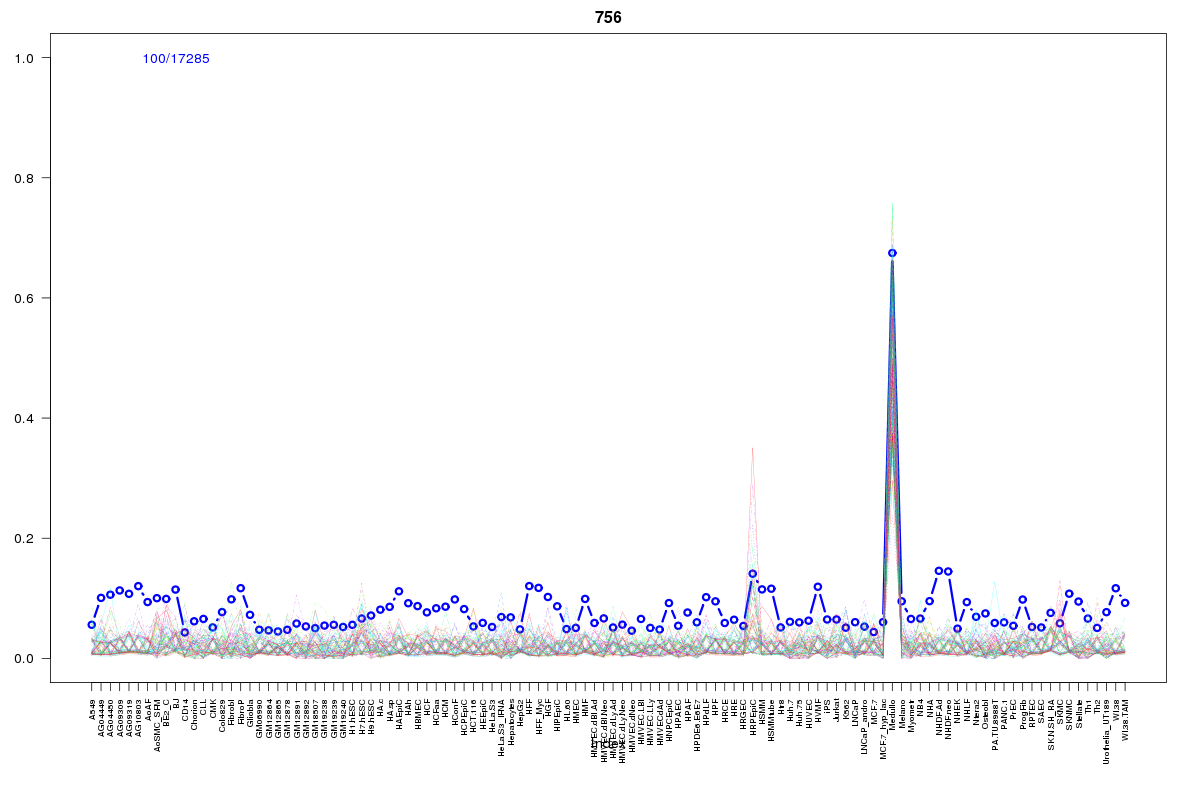 | 756 | 1 |
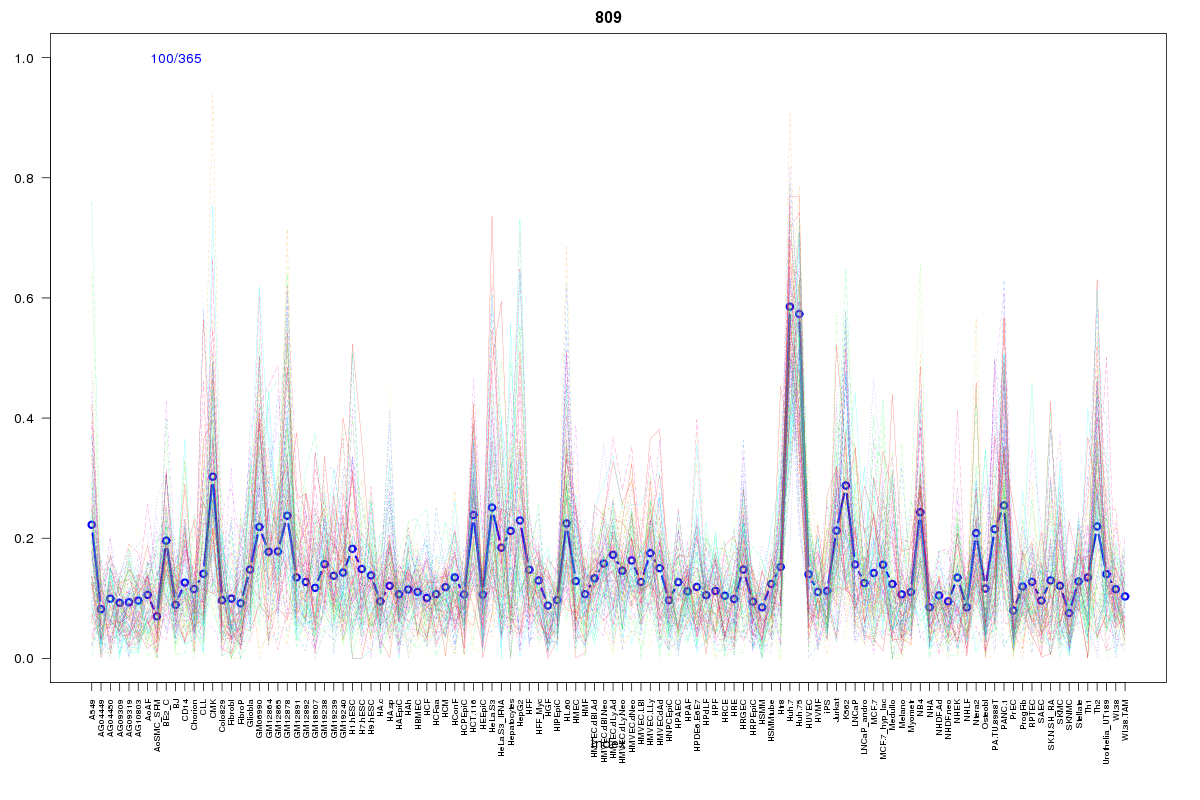 | 809 | 1 |
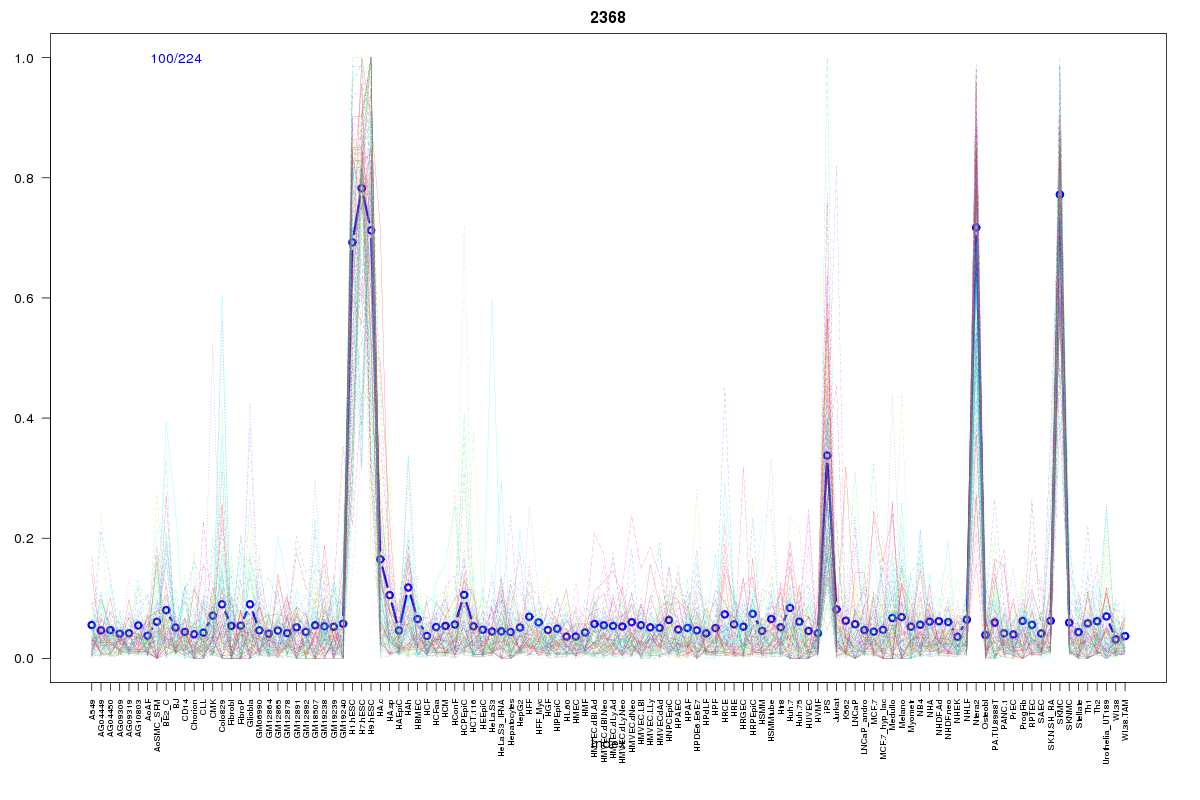 | 2368 | 1 |
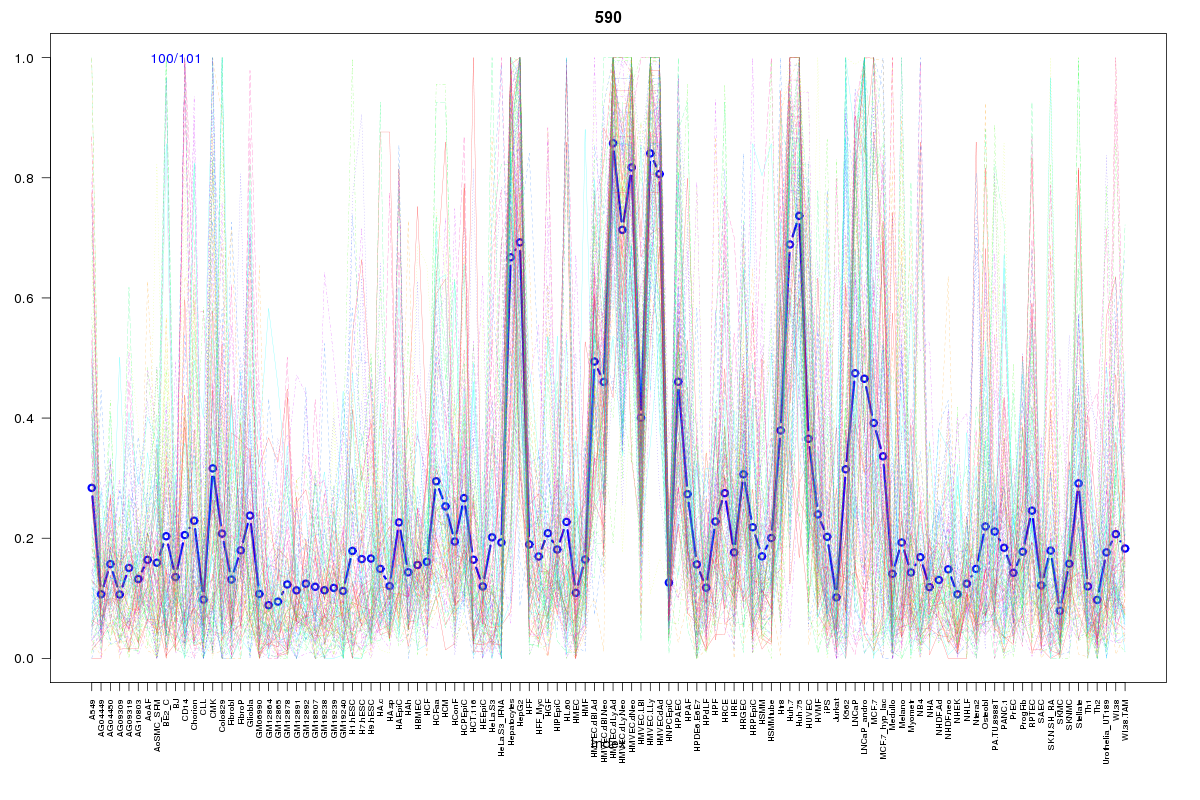 | 590 | 1 |
 | 775 | 1 |
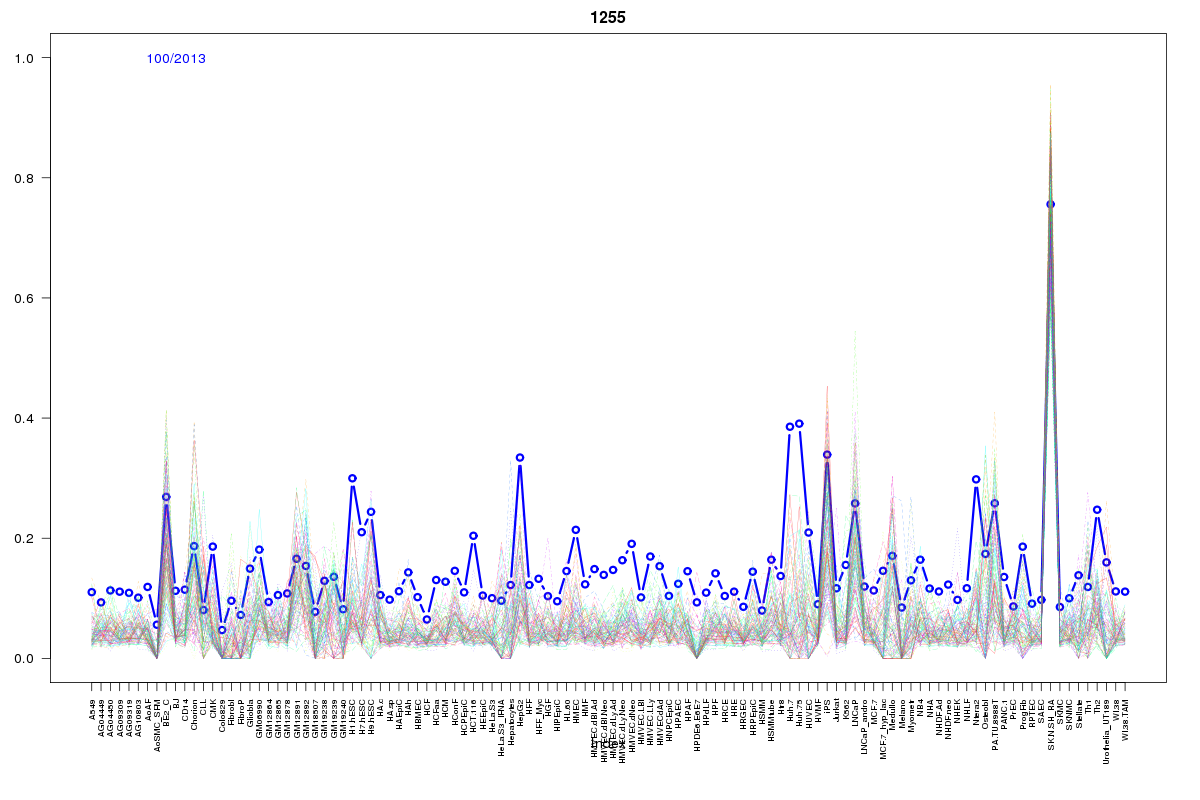 | 1255 | 1 |
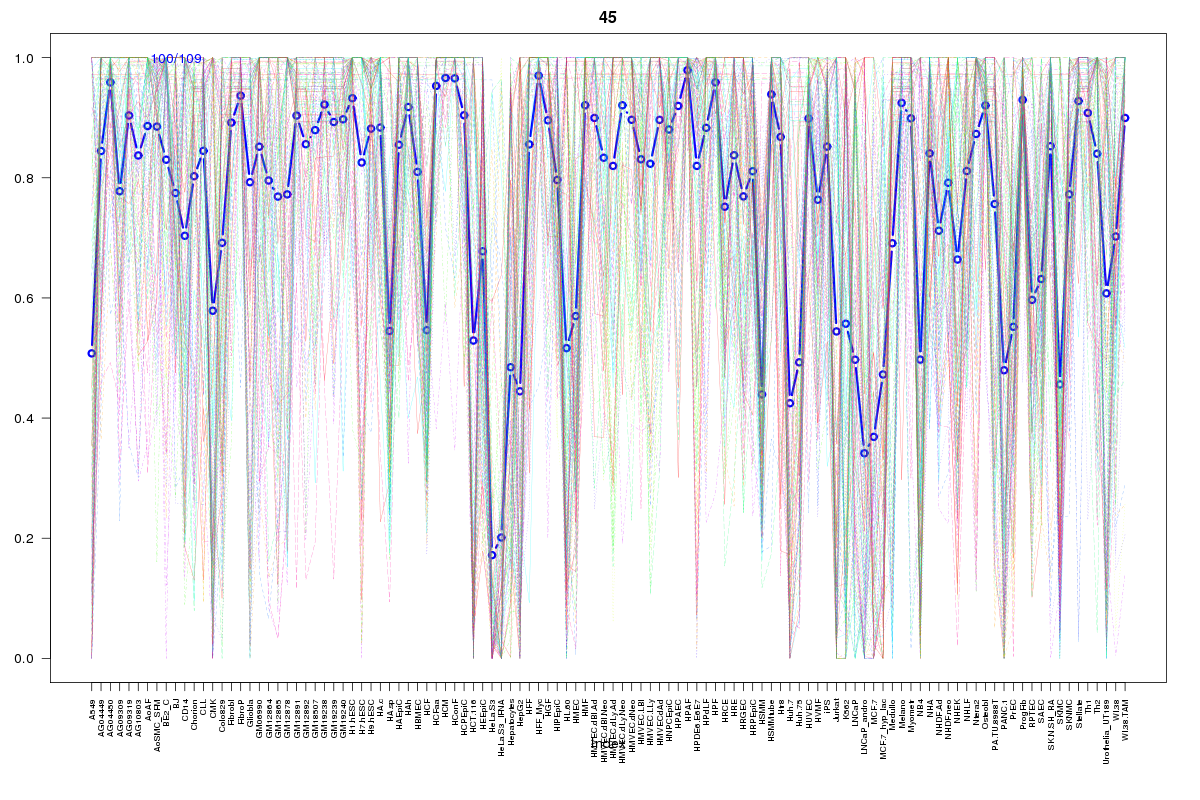 | 45 | 1 |
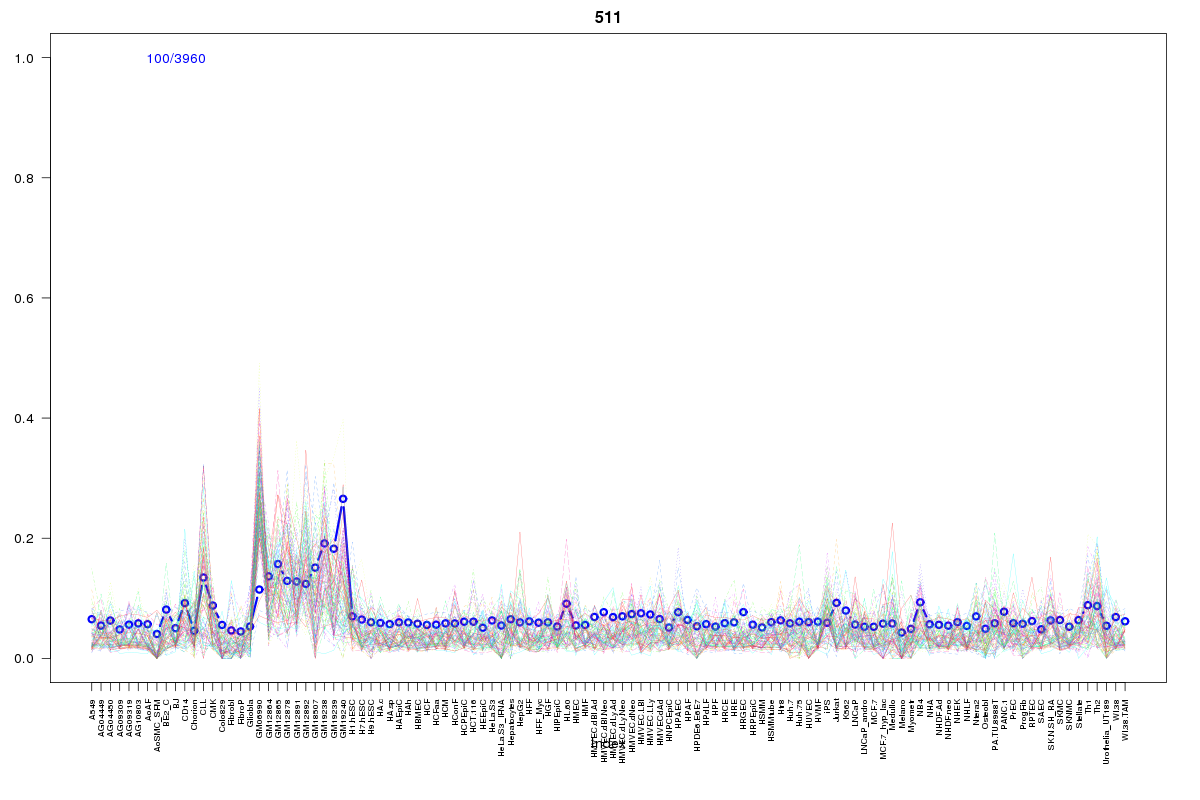 | 511 | 1 |
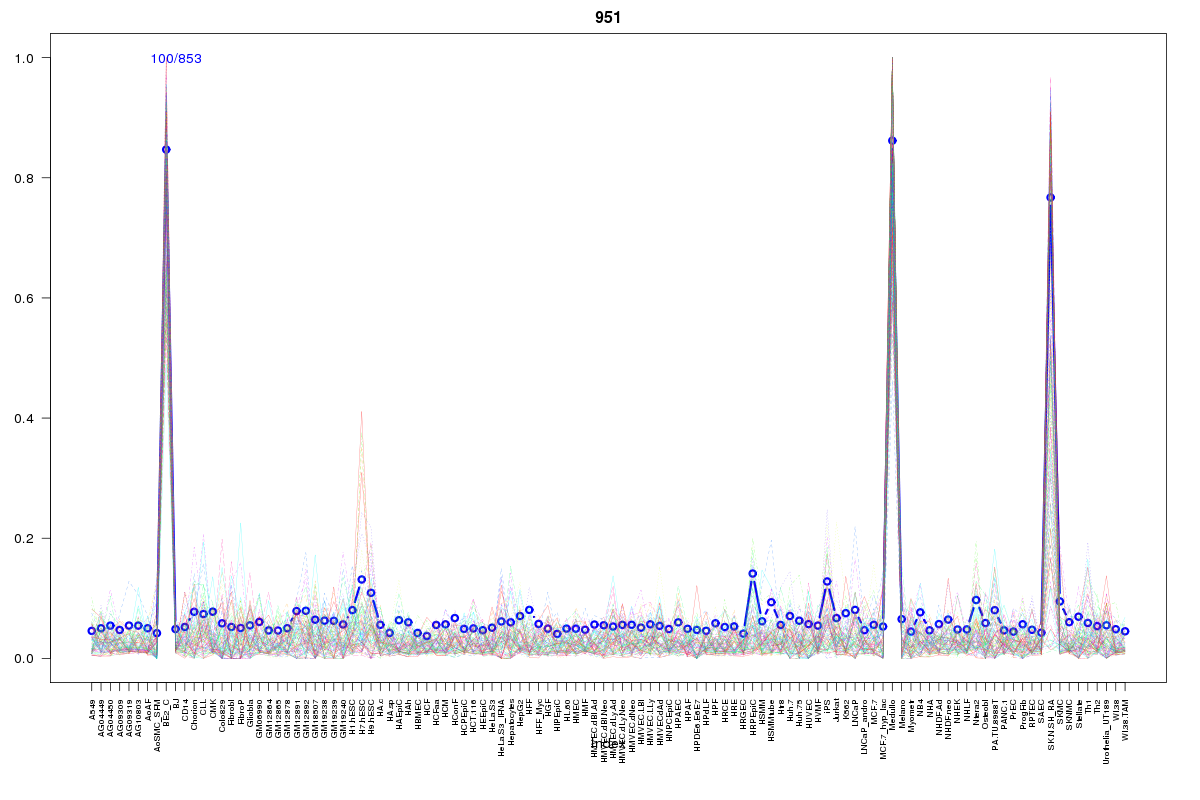 | 951 | 1 |
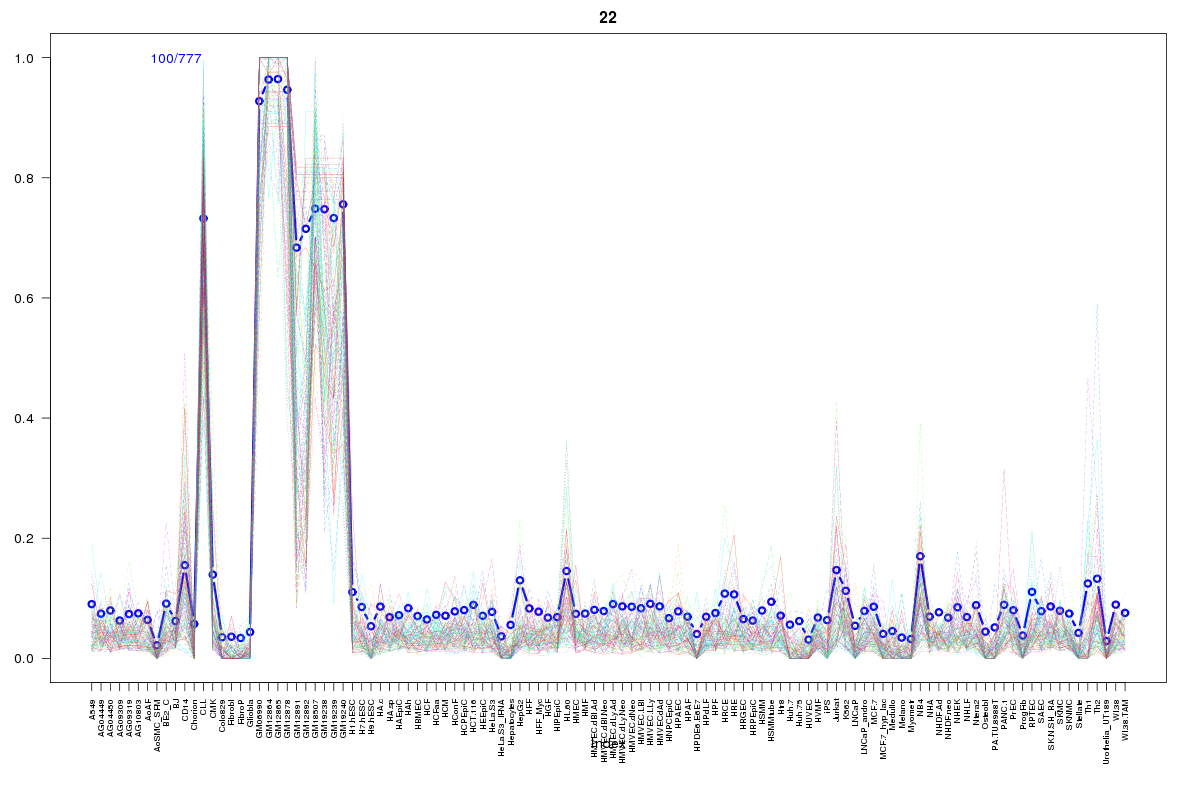 | 22 | 1 |
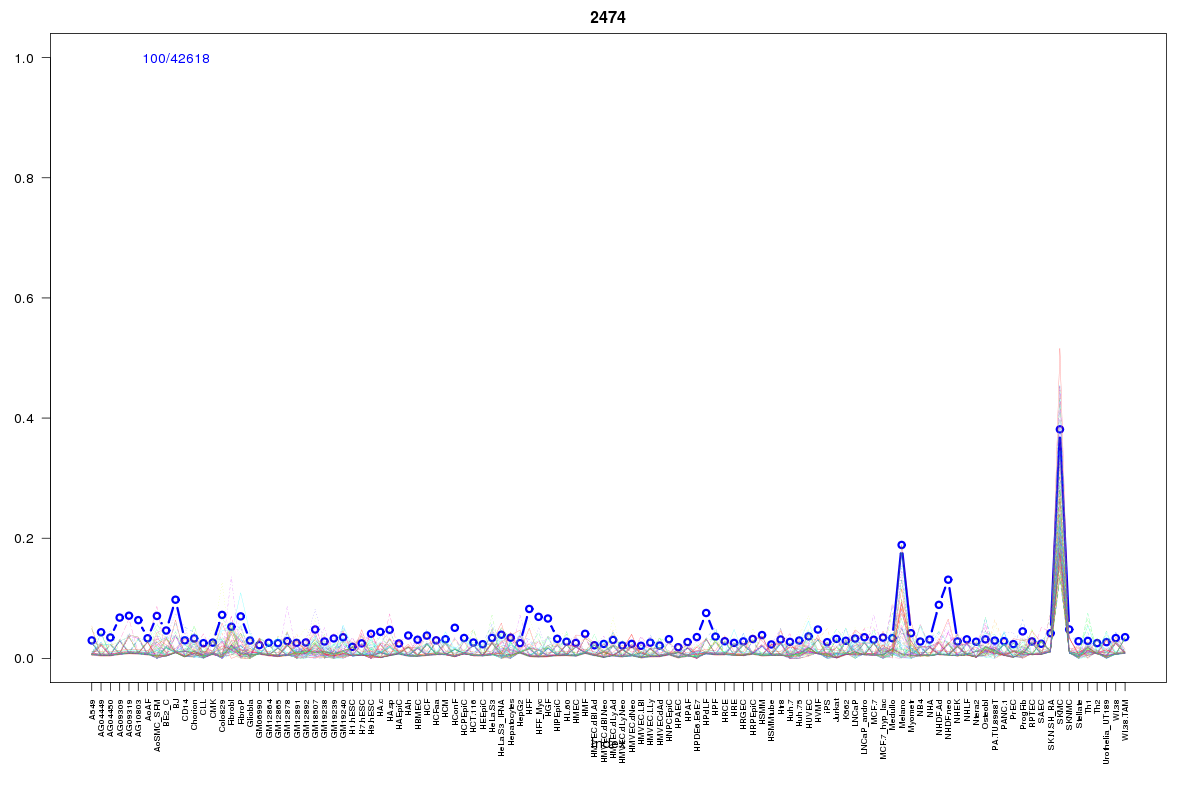 | 2474 | 1 |
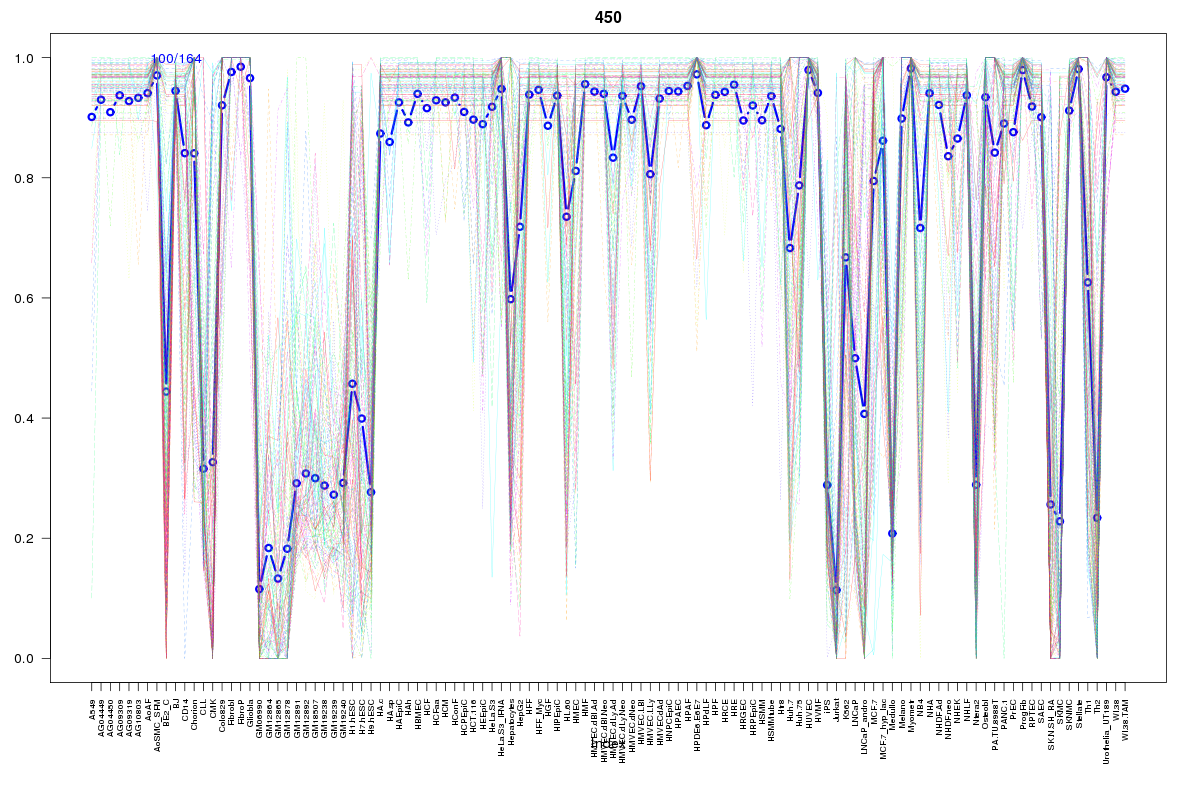 | 450 | 1 |
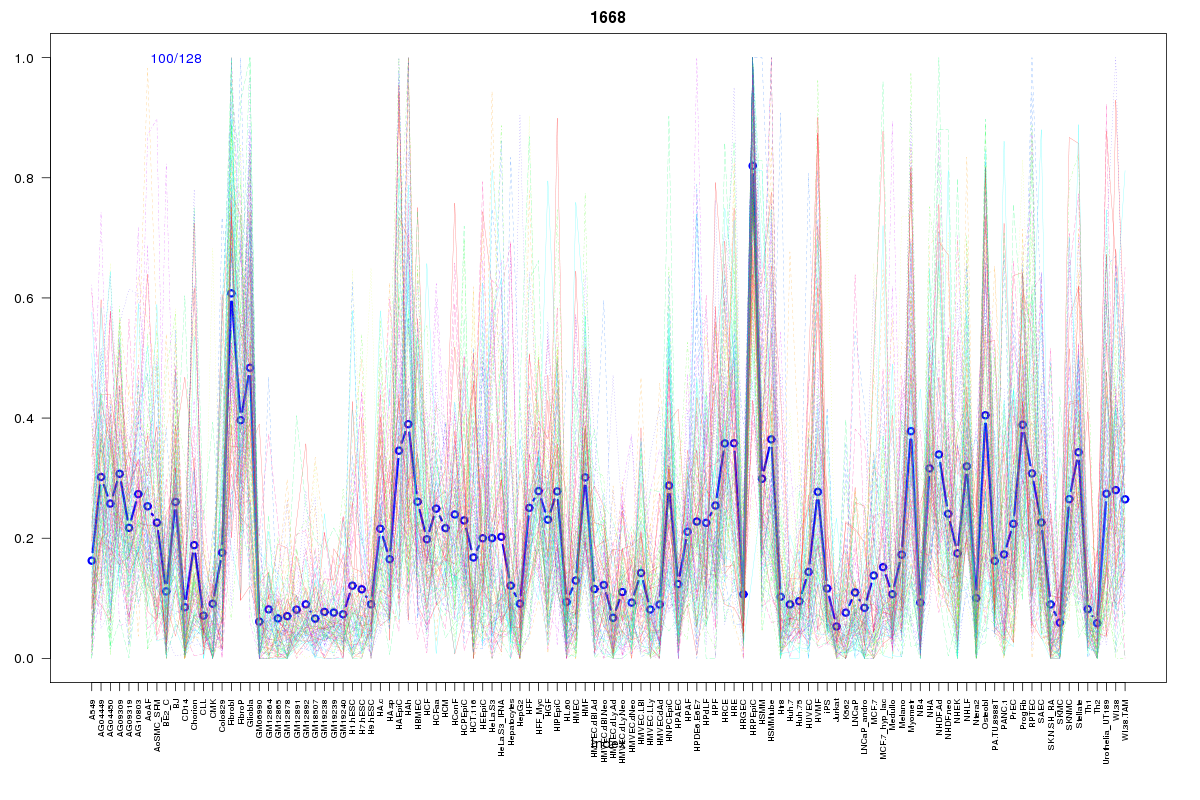 | 1668 | 1 |
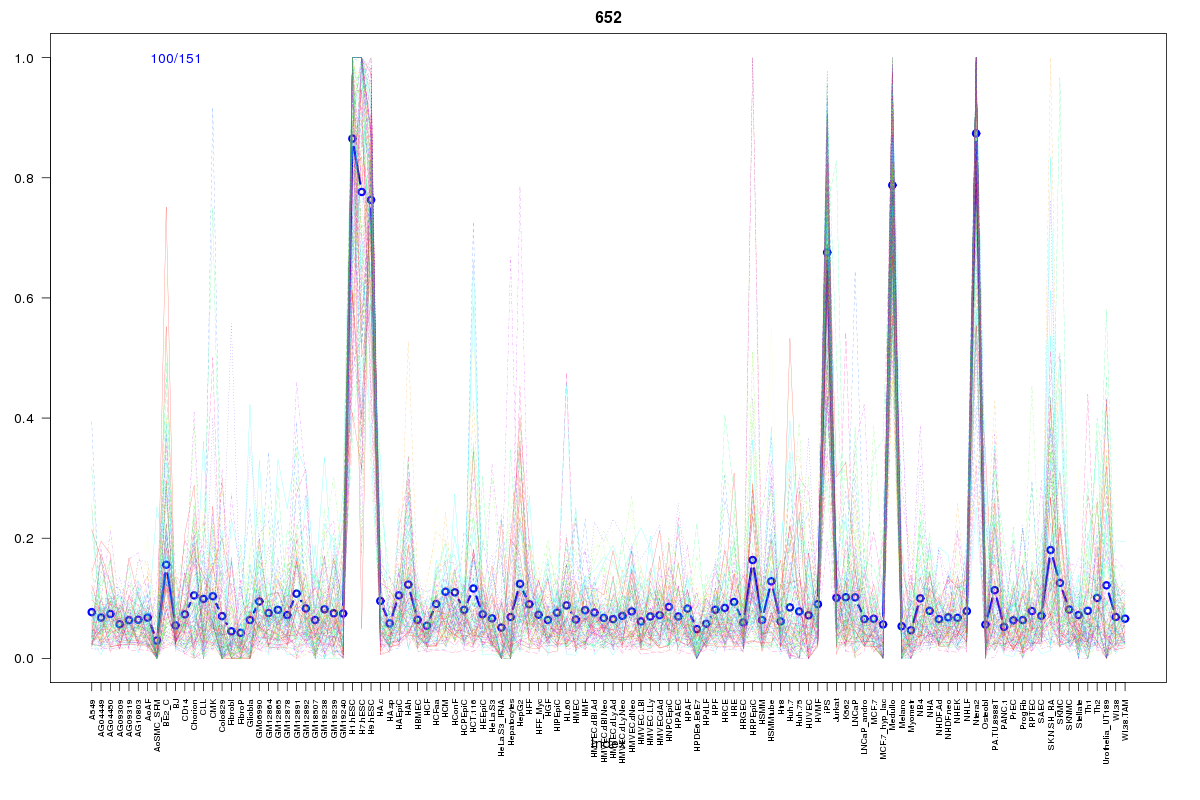 | 652 | 1 |
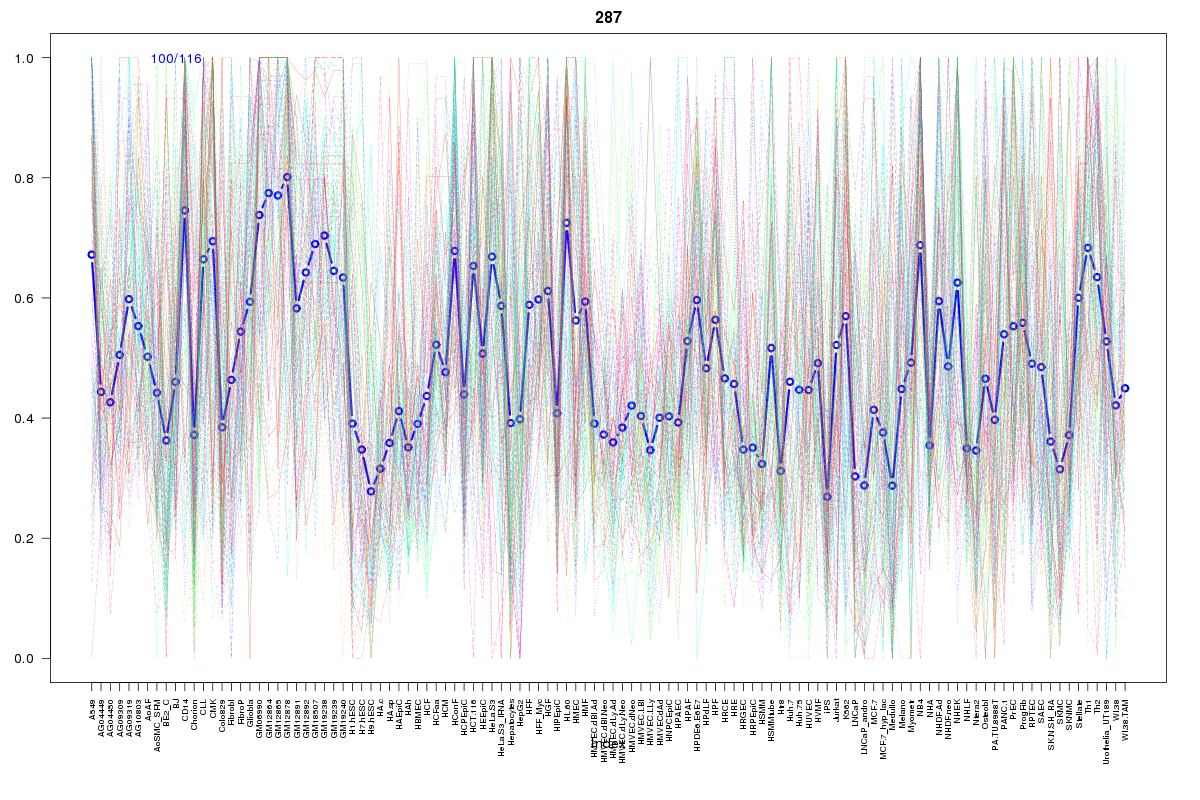 | 287 | 1 |
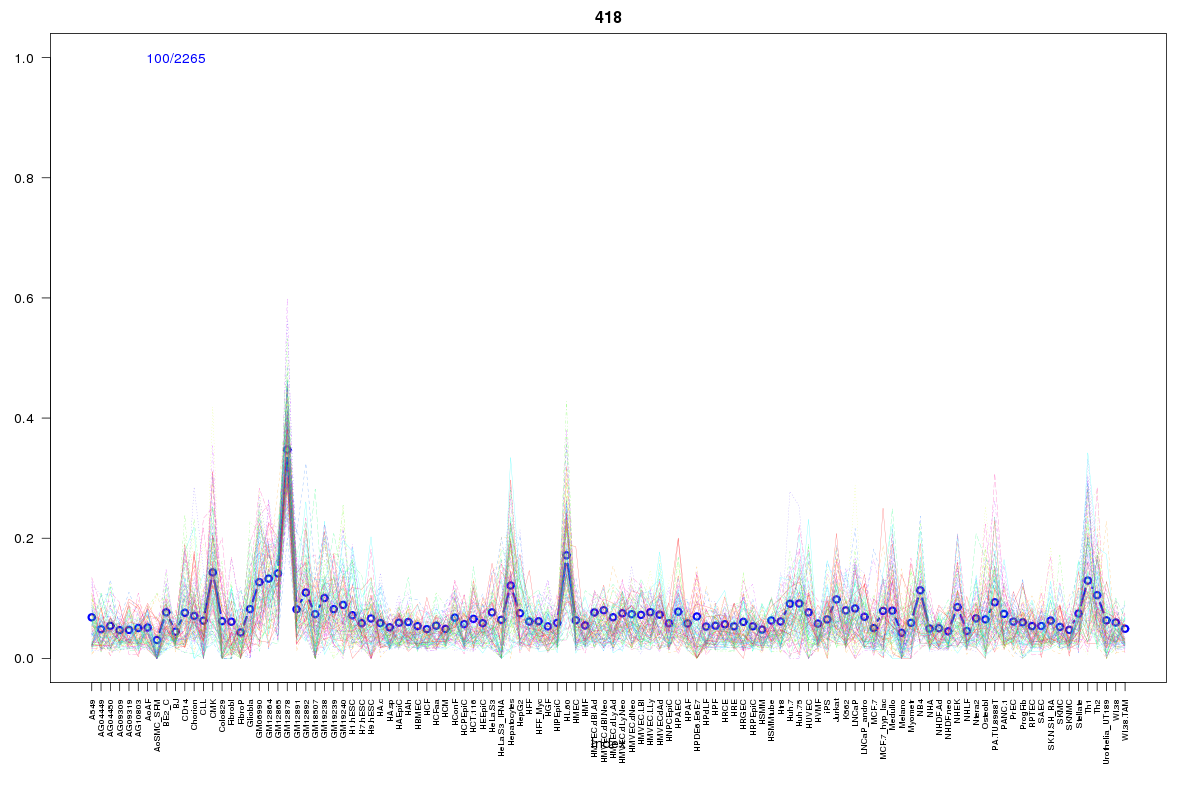 | 418 | 1 |
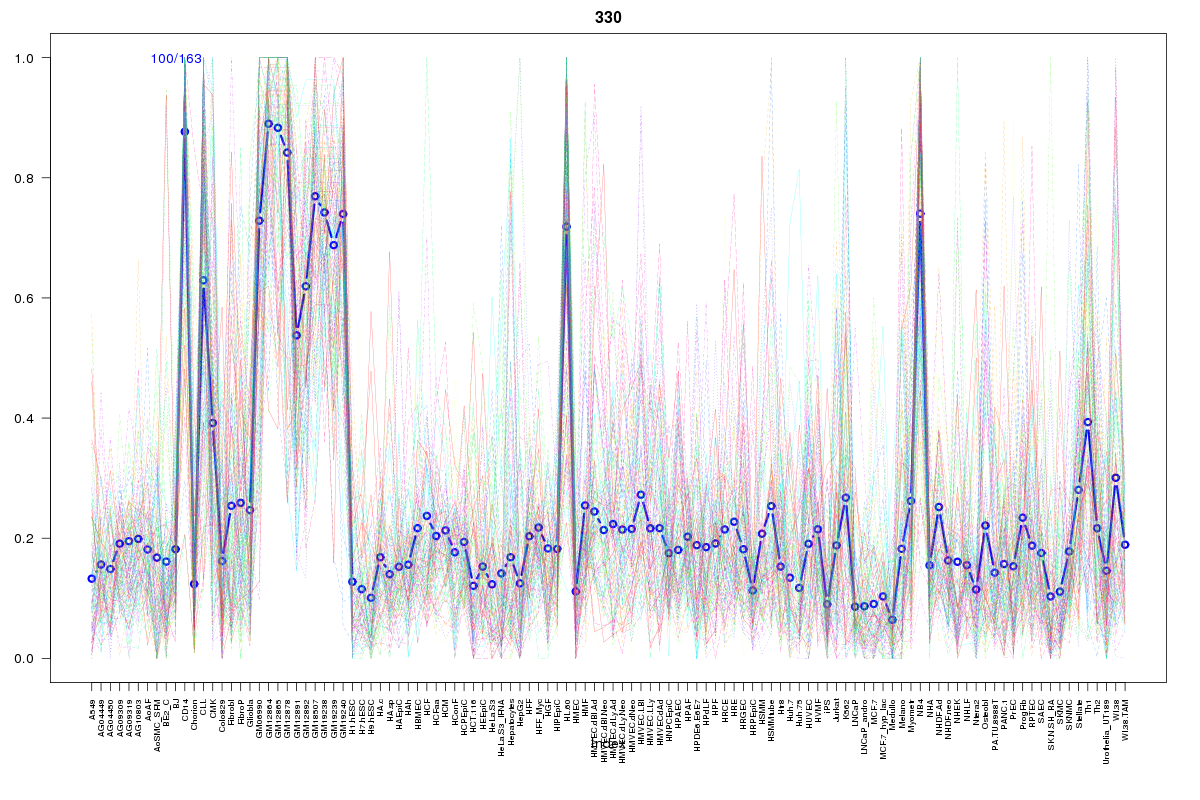 | 330 | 1 |
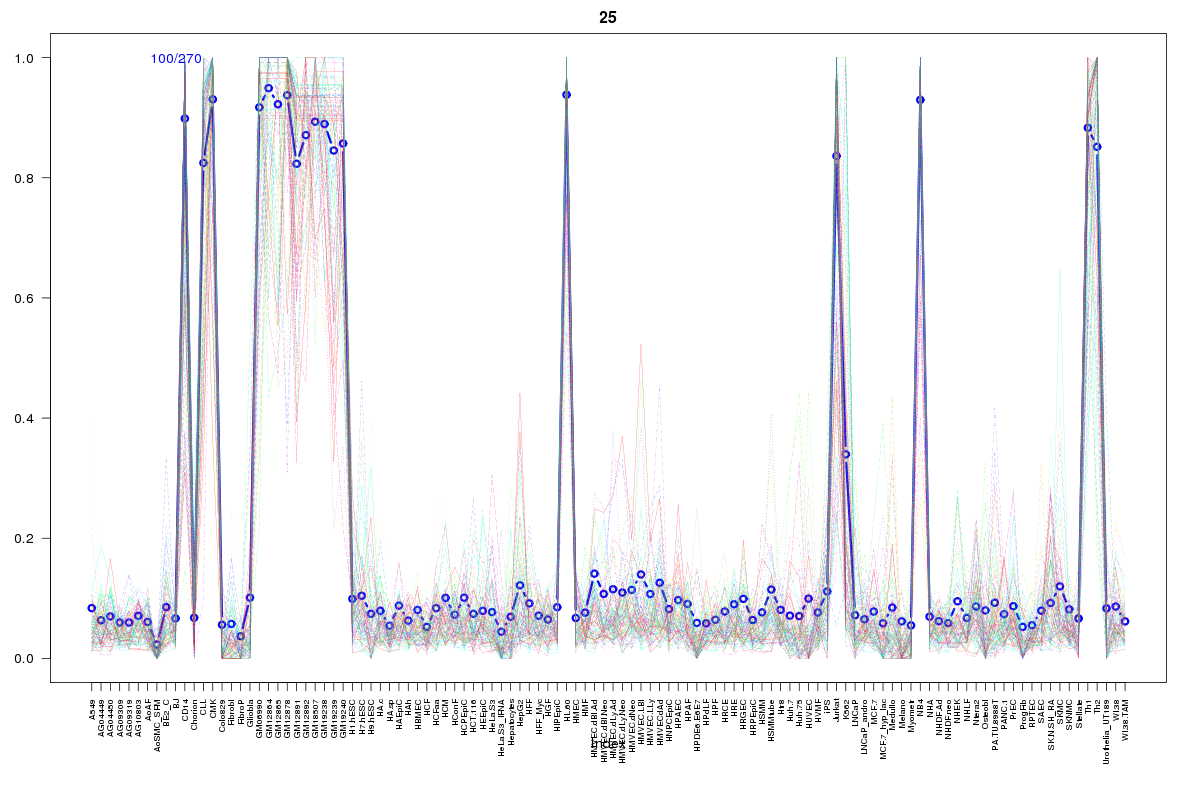 | 25 | 1 |
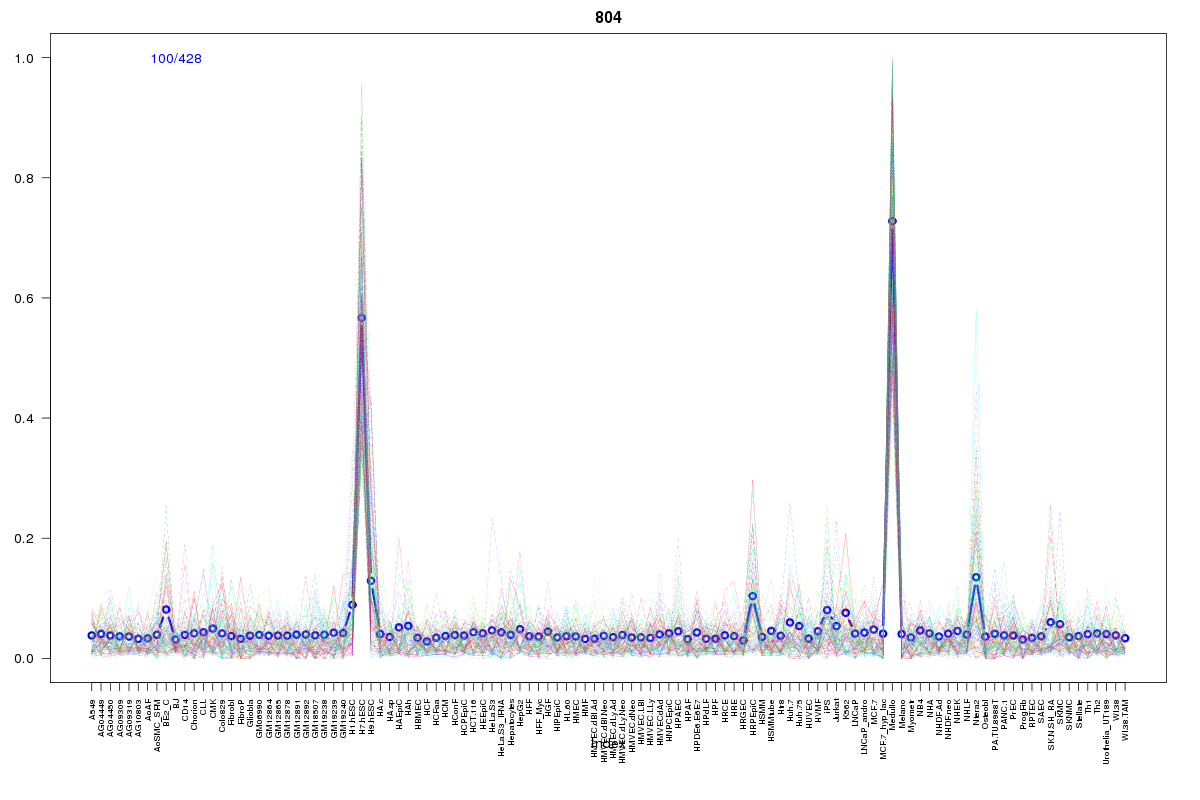 | 804 | 1 |
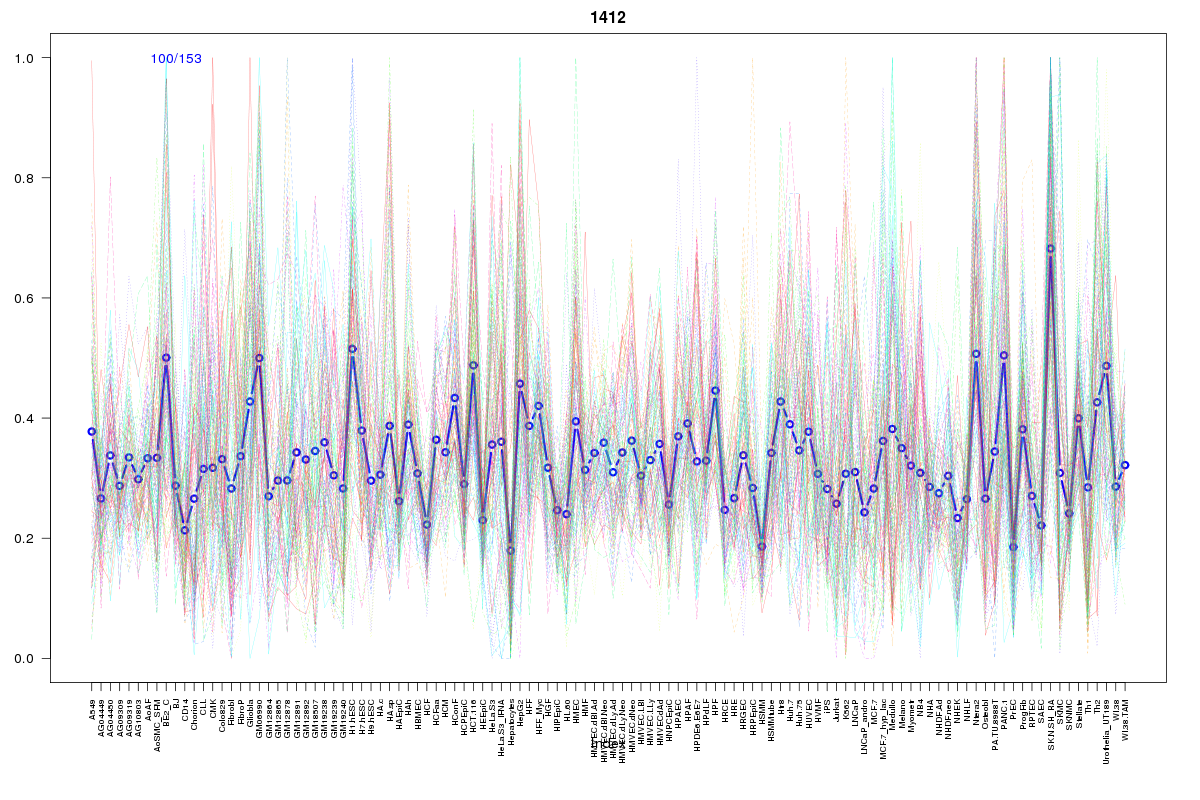 | 1412 | 1 |
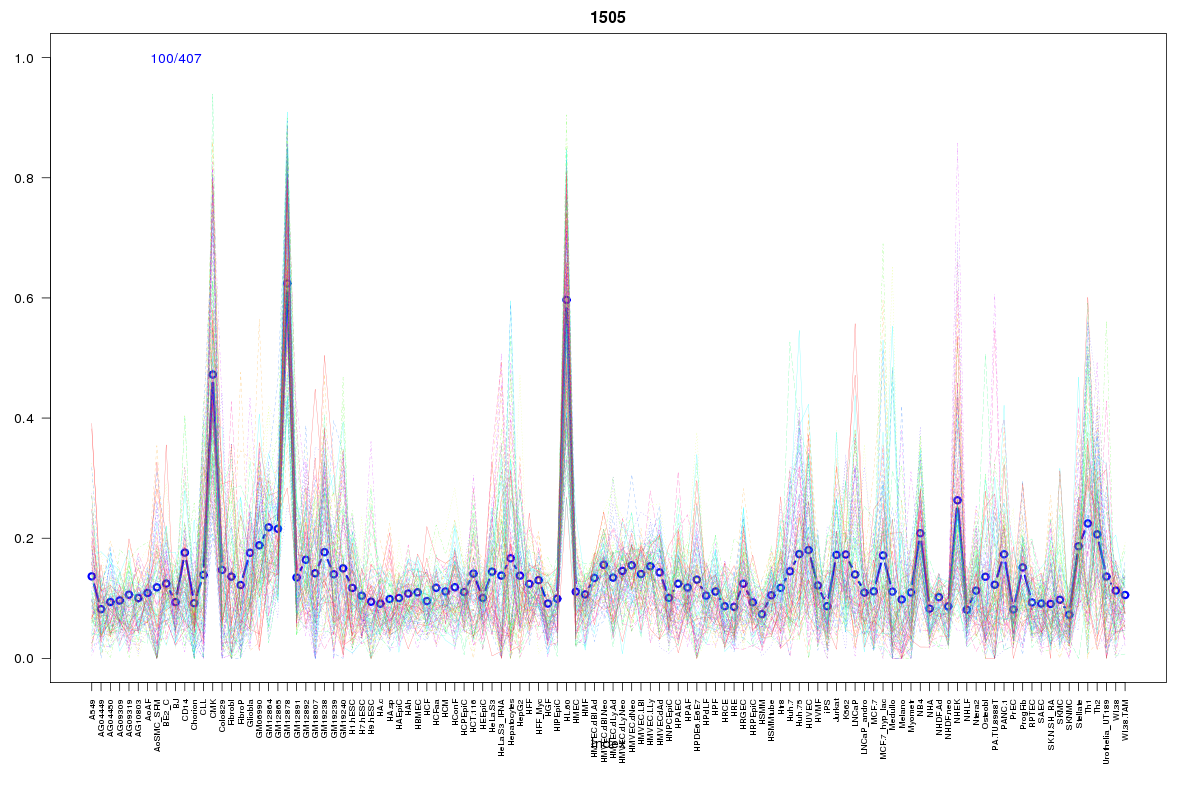 | 1505 | 1 |
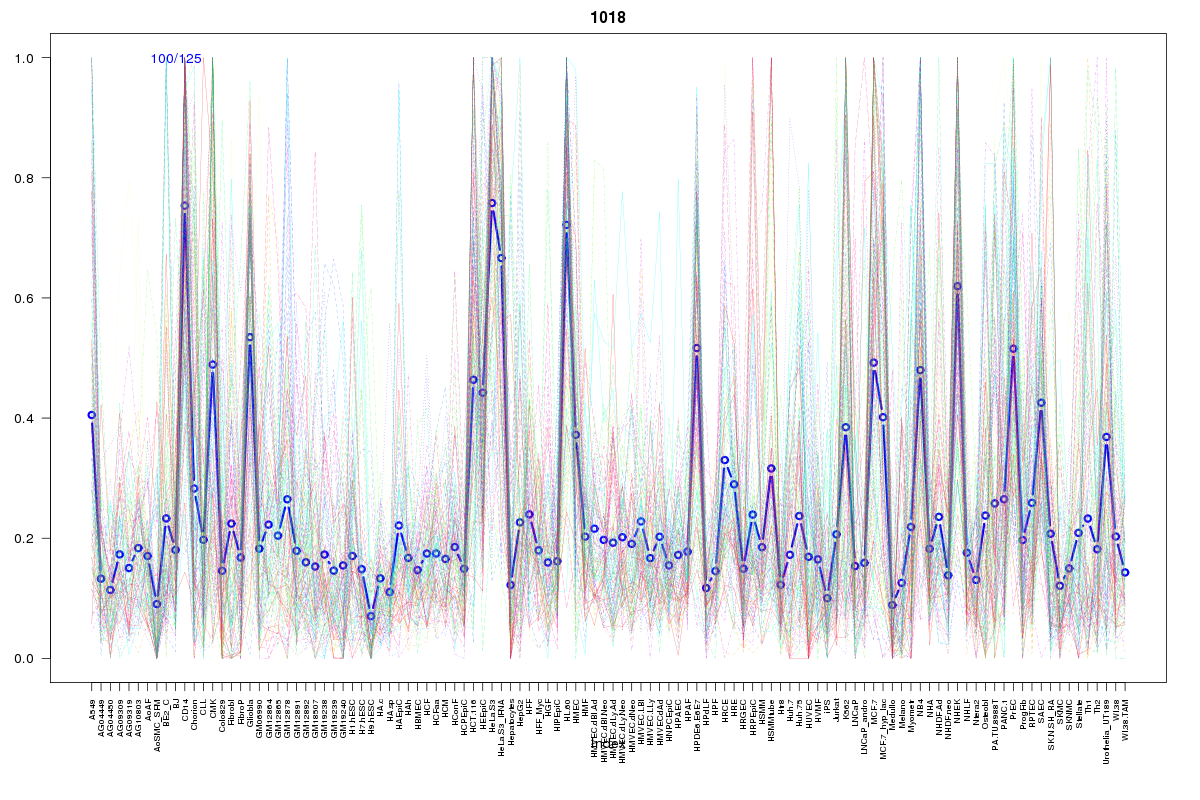 | 1018 | 1 |
Resources
BED file downloads
Connects to 55 DHS sitesTop 10 Correlated DHS Sites
p-values indiciate significant higher or lower correlation| Location | Cluster | P-value |
|---|---|---|
| chr1:156050180-156050330 | 157 | 0 |
| chr1:156050765-156050915 | 754 | 0 |
| chr1:156052960-156053110 | 553 | 0 |
| chr1:156051065-156051215 | 1405 | 0.001 |
| chr1:156043620-156043770 | 652 | 0.002 |
| chr1:156044405-156044555 | 10 | 0.002 |
| chr1:156050525-156050675 | 759 | 0.002 |
| chr1:156031360-156031510 | 2368 | 0.002 |
| chr1:156051725-156051875 | 1405 | 0.002 |
| chr1:156051880-156052030 | 203 | 0.002 |
| chr1:156052580-156052730 | 1268 | 0.002 |
External Databases
UCSCEnsembl (ENSG00000254726)